Will coronavirus reduce emissions long term?

This research, published by MSCI, looks at how emissions will be affected by the coronavirus pandemic.
- Our analysis indicates that global emissions for 2020 will most likely go down by 2.1% compared to 2019 levels, given the current effects of COVID-19 on economies across the globe.
- That reduction represents an 8.3% decrease from what the emissions level might have been without a decline in economic activities in the first quarter.
- Despite this estimated reduction, the drop is well short of achieving a target of net zero emissions by 2050.
In a crisis, people often try to find a silver lining in a dark cloud. In the COVID-19 pandemic, such silver linings could include:
- Advancing the digital transformation
- Renewed recognition of our health-care workers and systems
- Reduced carbon emissions for 2020
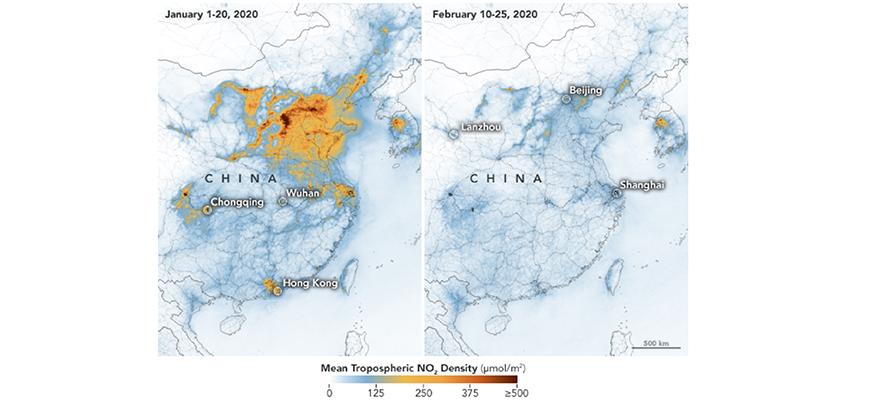
But what has been the effect on carbon emissions? We examined the empirical data so far, to understand the potential impact. Initial evidence from satellite imagery from NASA and the European Space Agency has shown that nitrogen dioxide (NO2) levels — an air pollutant formed when fossil fuels burn at high levels — over China dropped when the country was in lockdown, as we can see in the below images. We could potentially see the same effects in other countries that have implemented a nationwide lockdown and closed their borders (e.g., Italy, France, Spain and Germany) because of reduced road and air travel, power generation and industrial output. One might anticipate a significant decline in global greenhouse-gas (GHG) emissions in 2020.
Nitrogen dioxide levels over China plunged
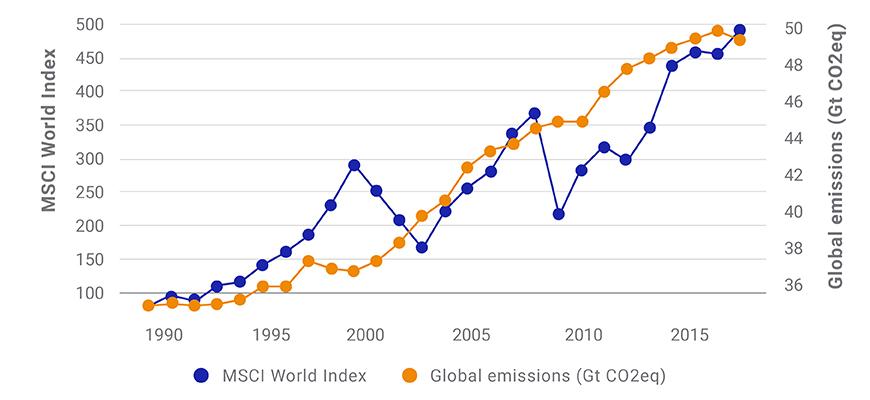
Emissions historically have been strongly correlated with economic activity, despite signs that some key developed markets and companies may be starting to decouple the two.
Stock prices have often been viewed as reflecting the collective market intelligence about companies’ market prospects. A high stock-market value has tended to coincide with a period of heightened economic activity and thus might serve as a rough proxy for emissions. However, we found this relationship didn’t always hold, particularly during market drops. Looking at correlations between emissions and the MSCI World Index (which consists of equities from 23 developed markets), we found that emissions are more sensitive to downturns — or maybe increases in market values were not as strongly related to real economic output as we might have thought. Is there a better measure that we can create by combining different country and thematic indexes, to more closely track CO2 emissions? What would a regression model calibrated to next year’s emissions estimate for 2020?
Global emissions and the MSCI World Index have been correlated — except in downturns
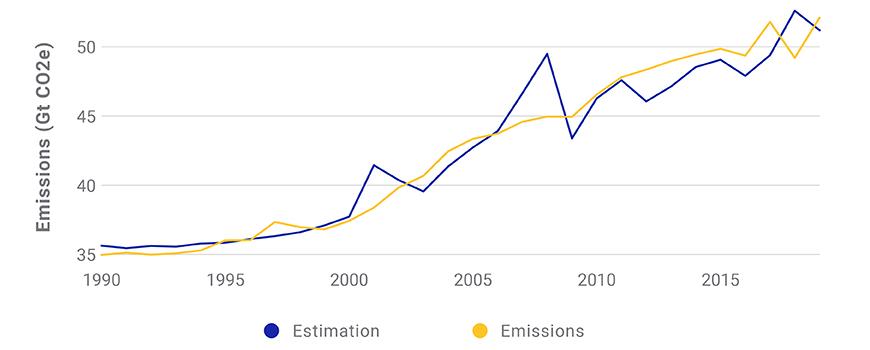
Historically, equity prices can be an indicator of near-term economic growth. With carbon emissions, we might expect a tighter relationship between economic growth and global emissions for the sectors that had large impacts on global emissions. Hence, building a statistical model that emphasizes high-emission sectors could provide such insight. We found that time-series data from the MSCI ACWI Materials Index, MSCI ACWI Utilities Index and MSCI World Index (which includes all sectors) worked well for a statistical model. We chose those three indexes because they carry some of the highest carbon-intensity levels, and thus should have the strongest relation to overall emissions. The model was optimized to estimate global emission levels for the current year (y) based on the given index levels at the end of the previous year (y-1). The exhibit below shows how the model would have performed over the last 30 years, with a correlation of 92.8% between the estimated and observed emissions.
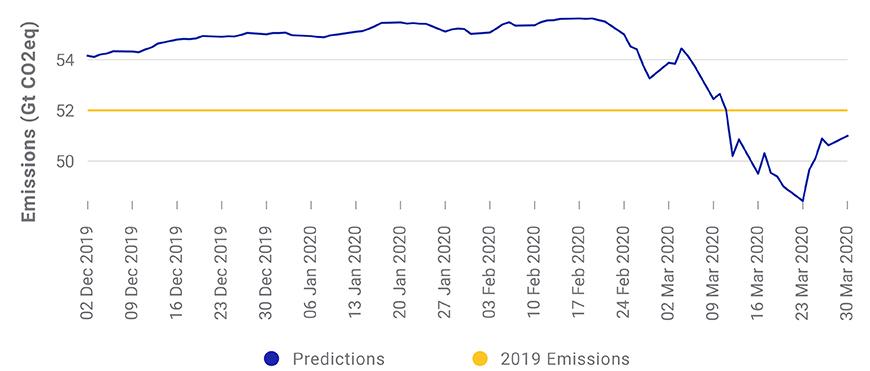
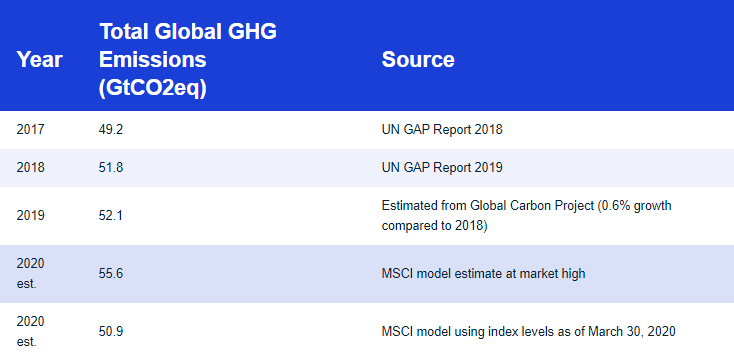
The next exhibit shows how estimates for total 2020 emissions have evolved, using the combined index returns as a proxy for anticipated economic activity since Dec. 1, 2019. The high point was at 55.6 total global GHG emissions (GtCO2eq) for 2020, reflecting positive investor sentiment at the end of 2019 (see the table below) — a path not at all compatible with reducing emissions or the goals of the 2015 Paris Climate Agreement. In contrast, given the market levels as of March 30, 2020, the model predicted 2020 totals at around 50.9 gigatons (Gt) of CO2-equivalent emissions, a 2.1% decrease from 2019 levels or an 8.3% decrease from the emission levels predicted at the beginning of 2020.
Modeled estimates for global emissions
This modeled decline in 2020 emissions does not necessarily indicate a structural change to our current world economy. The estimated emission levels are still comparable to those observed over the past five years, and the economy could readily rebound, returning emissions to prior levels. China already increased its industrial output when their quarantine began to slowly lift. Once Europe and the U.S. lift lockdowns and reopen borders, travel, commuting and economic output could return to “normal” levels. Thus, the projected decrease in global emissions could be short-lived. If so, the risk climate change poses to countries, companies and investors has not dissipated. A much more visible and immediate crisis has simply overshadowed it.
Climate Action