New satellite maps show dire state of ice melt in Antarctica and Greenland.
The world's largest glaciers are losing ice far faster than they can replenish it.
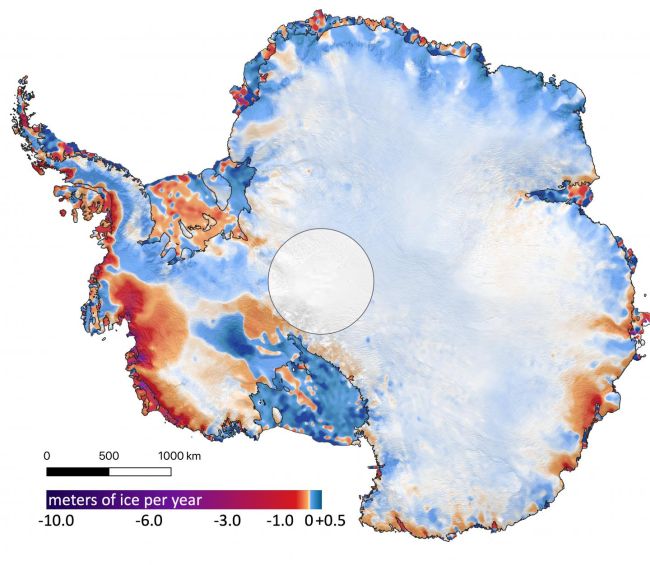
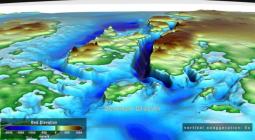
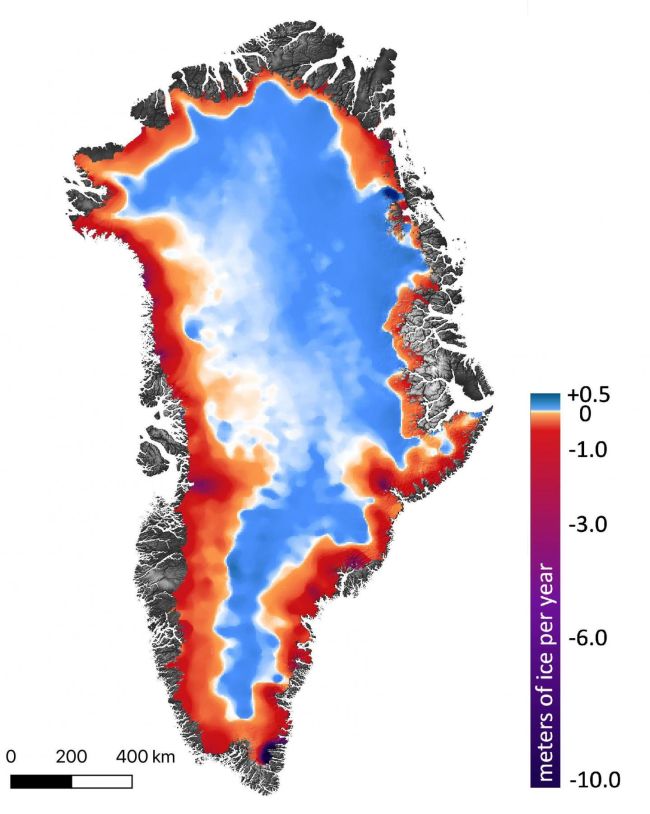
(Image: © Smith et al./Science)
Two new satellite images remind us that Earth's ice sheets are losing so much mass it's becoming obvious from space.
In the vivid new maps published as part of an April 30 study in the journal Science, researchers illustrated 16 years of ice loss in Greenland and Antarctica as seen by a laser-emitting NASA satellite. The images paint a picture of rapid melt around the coasts of both regions (shown in red and purple in the maps), far outweighing modest ice-mass gains (shown in light blue) farther inland.
Greenland's ice sheet lost an average of 200 gigatons of ice per year, while Antarctica's ice sheet lost an average of 118 gigatons per year; for reference, a single gigaton of ice is enough to fill 400,000 Olympic-sized swimming pools, the researchers said in a statement.
All that melting ice was responsible for a total 0.55 inches (14 millimeters) of sea-level rise between 2003 and 2019, the researchers found. That rise puts Earth on track for the worst-case climate warming scenario laid out in the Intergovernmental Panel on Climate Change's (IPCC) latest report, previous research found. That scenario would put hundreds of millions of people living in coastal communities at risk of losing their homes — or their lives — to flooding.
For the new study, the researchers used the newest data from NASA's ICESat-2 satellite, which launched in 2018 to monitor elevation changes on land (and ice) around the world by bathing the planet in laser beams. The team compared 2019 elevation levels with data recorded by the satellite's predecessor — named simply ICESat — between 2003 and 2009. At thousands of locations where the two datasets overlapped, the team could see precisely how much ice had vanished from Greenland and Antarctica between 2003 and 2019.
Ice shelves — enormous ledges of ice floating over the ocean at the edges of Greenland and Antarctica — lost the most mass by far in both regions, the researchers said. While ice shelves are already partially submerged in water and therefore do not actively raise sea levels when they melt, they provide a structural integrity to glaciers that prevents ice farther inland from gushing into the sea.
"It's like an architectural buttress that holds up a cathedral," study co-author Helen Amanda Fricker, a glaciologist at Scripps Institution of Oceanography at the University of California, San Diego, said in the statement. "The ice shelves hold the ice sheet up. If you take away the ice shelves, or even if you thin them, you're reducing that buttressing force, so the grounded ice can flow faster."
Predictably, the new research shows, as the ice shelves surrounding Antarctica and Greenland have thinned and melted over the last two decades, grounded ice farther inland has thinned and melted too.
The new analysis reveals, with unprecedented detail, the response of these ice sheets to changes in climate, "revealing clues as to why and how the ice sheets are reacting the way they are," study co-author Alex Gardner, a glaciologist at NASA's Jet Propulsion Laboratory in Pasadena, California, said in the statement.
6 May 2020
LIVE SCIENCE