One, two, tree: how AI helped find millions of trees in the Sahara.
Efforts to map the Earth’s trees are growing – and could change our understanding of the planet’s health.
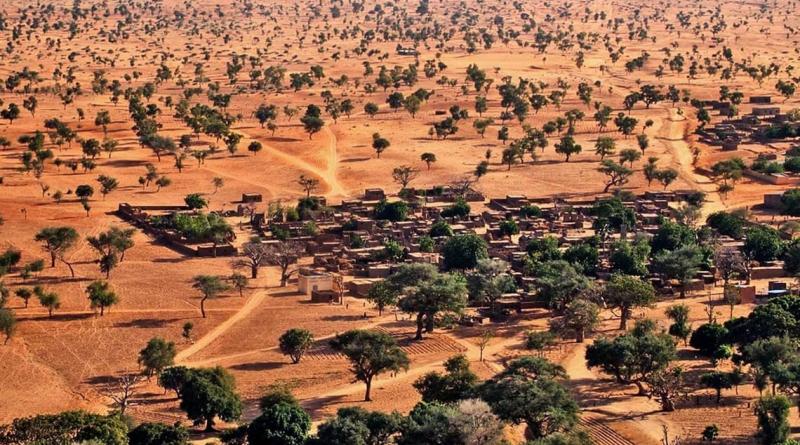
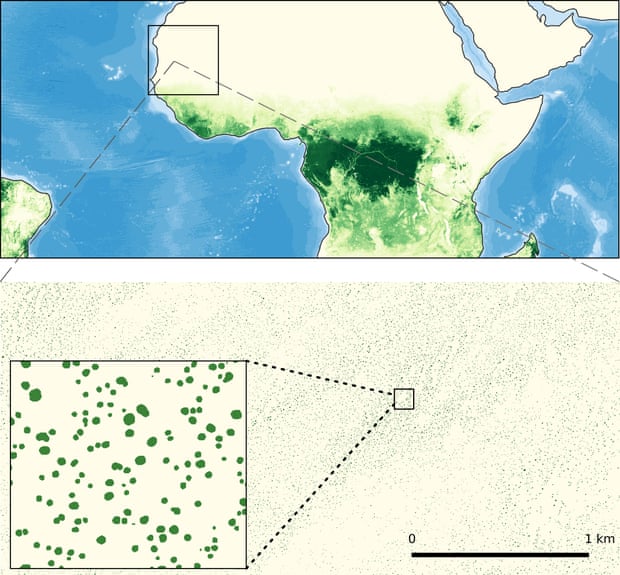
When a team of international scientists set out to count every tree in a large swathe of west Africa using AI, satellite images and one of the world’s most powerful supercomputers, their expectations were modest. Previously, the area had registered as having little or no tree cover.
The biggest surprise, says Martin Brandt, assistant professor of geography at the University of Copenhagen, is that the part of the Sahara that the study covered, roughly 10%, “where no one would expect to find many trees”, actually had “quite a few hundred million”.
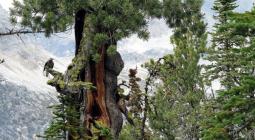
Trees are crucial to our long-term survival, as they absorb and store the carbon dioxide emissions that cause global heating. But we still do not know how many there are. Much of the Earth is inaccessible either because of war, ownership or geography. Now scientists, researchers and campaigners have a raft of more sophisticated resources to monitor the number of trees on the planet.
Satellite imagery has become the biggest tool for counting the world’s trees, but while forested areas are relatively easy to spot from space, the trees that aren’t neatly gathered in thick green clumps are overlooked. Which is why assessments so far have been, says Brandt, “extremely far away from the real numbers. They were based on interpolations, estimations and projections.”
The most recent attempt at a global tally of trees was in 2015, when researchers, using a combination of satellite data and ground measurements, estimated there were just over 3tn. This was a dramatic increase from the previous estimate of 400bn in 2009, which was based on satellite imagery alone.
The research by Brandt and his colleagues in west Africa promises a more accurate picture in the future. In a collaboration with Nasa’s Goddard Space Flight Center, they were able to use satellite images from DigitalGlobe, previously available only to commercial entities, which were high enough resolution to make out individual trees and measure their crown size.
Using AI deep learning, and one of the world’s most powerful supercomputers – Blue Waters at the University of Illinois – the team was able to count individual trees from space for the first time. They manually marked nearly 90,000 across a variety of terrain, so the computer could “learn” which shapes and shadows indicated the presence of trees. This enabled them to count every tree with a crown size of at least 3 sq metres in a 1.3m sq km area comprising mostly the Sahara but also the semi-arid Sahel area along the southern edge of the desert and a sliver of the sub-humid zone beneath that. Overall, they detected more than 1.8bn trees.
Those in the Sahara tended to be clustered around human settlements. Arid areas had on average 9.9 trees per hectare, rising to 30.1 in semi-arid zones and 47 in the southernmost sub-humid rim of the patch being studied. There were just 0.7 trees per hectare in areas classified as “super-arid”.
“Most maps show these areas as basically empty,” says Brandt. “But they’re not empty. Our assessment suggests a way to monitor trees outside of forests globally, and to explore their role in mitigating degradation, climate change and poverty.”
Keeping the planet’s arboreal accounts is key to understanding the impact trees are having on our planet’s health. If the number of trees can be mapped, so can the amount of carbon they store.
The most high-profile existing world tree map is released annually by Global Forest Watch. Launched by the World Resources Institute (WRI) in 2014, it uses data from Nasa Landsat satellites (which don’t have as high resolution as commercial equivalents) to keep tabs on what it diplomatically calls “tree cover loss”.
Previously, information on the changing shapes of forests was collated every five years or so by the UN Food and Agriculture Organization, which had to take the numbers on trust from individual countries. The WRI’s aim was to make assessing deforestation data transparent.
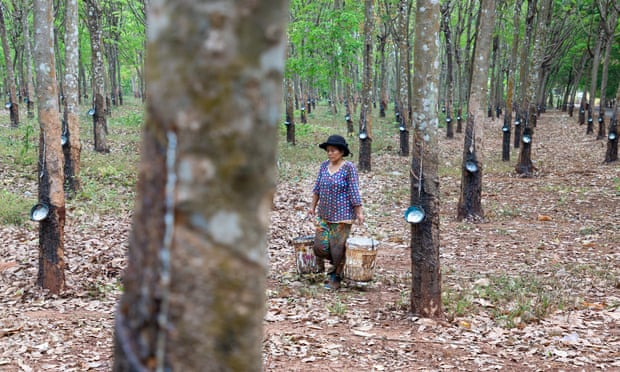
Weekly alerts are generated for reductions in forest size in the tropics. “Cambodia basically said they had no deforestation,” says Fred Stolle, deputy director of WRI’s forest programme, “but there’s been so much. The car industry is getting bigger and bigger and we need tyres. Rubber grows well in the tropics and so Cambodia has an enormous amount of deforestation to plant new rubber trees.”
Alerts have also appeared for Ghana, where destruction of primary forests jumped by 60% between 2017 and 2018 – the biggest rise anywhere in the tropics.
However, there is one aspect of the WRI map that Stolle concedes means the picture is incomplete. While the satellites easily show where trees have been cut down, “new tree growth is much more difficult to see. So while Global Forest Watch sees a lot of the deforestation, it doesn’t see much of the reforestation.”
Brandt expects that the higher resolution technology offered by the commercial satellites will become widely available in the coming years, helping to bridge this gap.
Another organisation tracking deforestation is environmental non-profit Canopy, founded in 1999 by its now executive director, Nicole Rycroft. It traces back supply chains for companies because, Rycroft says, “there’s no need to cut down 100-year-old trees to make pizza boxes or T-shirts, or for the trees to come from land inhabited by indigenous communities”.
Using information from a range of scientific sources, Canopy has packaged the raw data and satellite imagery into an interactive tool called ForestMapper, to help companies switch to sustainable supply chains. They can scan the map, which includes information on forest carbon density, endangered species, tree loss so far and projected deforestation over the coming decade. “We’re the applied science side,” says Rycroft, “making the data user-friendly.”
As well as highlighting risky supply chains, Canopy helps manufacturers find more sustainable sources, including recycled fibres, “so we don’t just shift the problem from one backyard to somebody else’s”.
“We work with 320-odd fashion brands,” Rycroft continues. “Including guys like H&M, Zara and Uniqlo, right down to luxury designers like Stella McCartney. And as you can imagine, there’s a wide range of motivations within those companies, but they’re all committed.”
Seven years ago, she recalls, few in the industry even knew that “200m trees were disappearing into rayon and viscose every year, and some of it from orangutan and grizzly bear habitats, really high carbon forest ecosystems”. Now, she says, “52% of global viscose production is verified by ourselves as being at low risk of originating from high carbon or high biodiversity forests. There’s still 48% of the supply chain to go, but in a relatively short space of time we’ve seen the global supply chain fundamentally starting to transform how they source.”
Hotspots on the map now include south-east Asia, Indonesia, Vietnam, Laos and Brazil. Working with local NGOs and campaigners, Canopy drills down into the regional detail. Some eucalyptus plantations in Indonesia, for example, are growing on high-carbon peatlands that need restoring. “And we’ve recently discovered that koala habitat in Australia has been logged for fabric production,” says Rycroft.
The same scrutiny applies to other supply chains, such as cardboard. “Which are the forests that provide the 3bn trees that disappear into food wrappings, pizza boxes or the packaging that lands on our doorsteps from e-retailers? Is it coming from a sustainably managed plantation? Is there recycled content? Or is it coming from a high-carbon value forest?”
What is hardest to monitor is the illegal clearing of the vast, as yet unknown numbers of trees that exist outside forests. Brandt’s team is close to submitting another research paper for which they have scanned 10 times the area covered by their initial study. As well as forests, says Brandt, individual trees are “valuable in mitigating climate change, providing a variety of ecosystems and services to people, and until now, it was impossible to map them”.
Find more age of extinction coverage here, and follow biodiversity reporters Phoebe Weston and Patrick Greenfield on Twitter for all the latest news and features
15 January 2021
The Guardian