Dr Jim McQuaid, of the University of Leeds, another co-director of the project, said: “To me it’s all about that lightbulb moment when someone understands it; that sudden ‘oh yeah, now I get it’.”
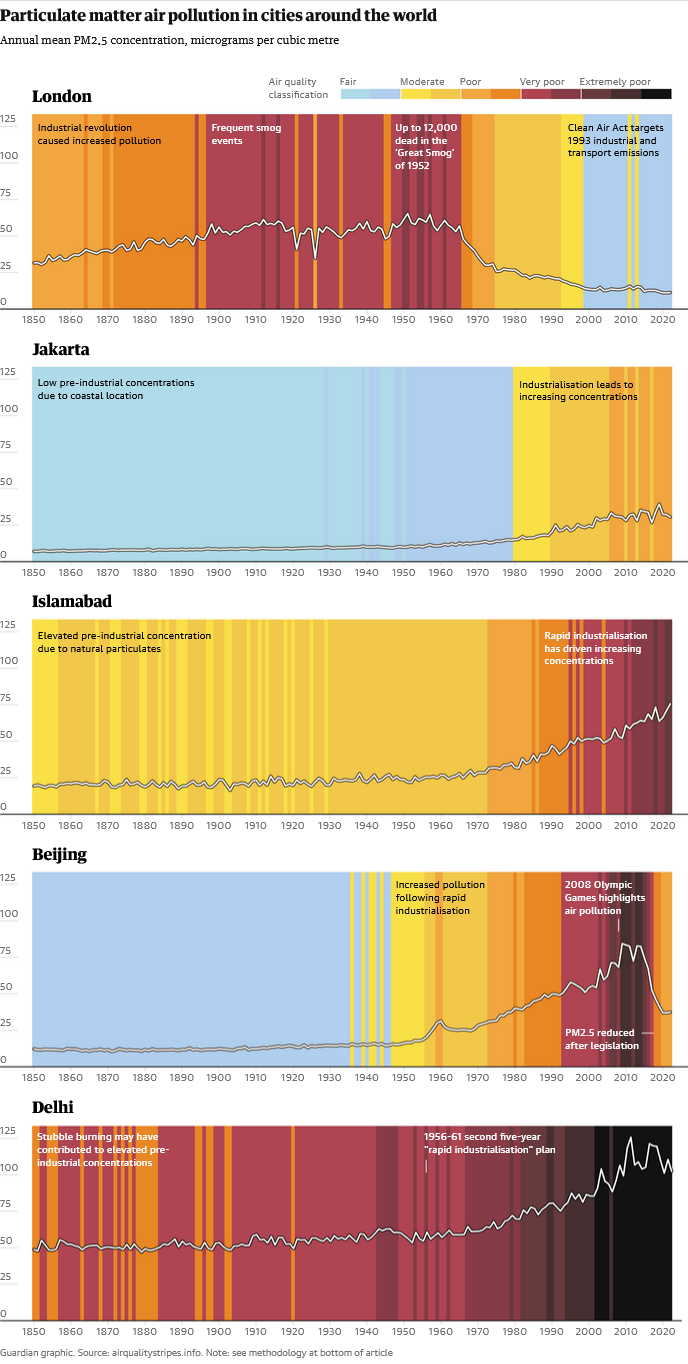
The stripes for London and Beijing show the huge improvements that can result when action is taken.
For more than a century London was plagued by coal induced smogs so thick that they were likened to pea soup. A reluctant government was finally forced to act when 12,000 people died from a week-long smog in 1952. Clean air acts followed. Coal use was replaced by heating oil and then fossil gas.
Beijing’s deteriorating air was largely unnoticed until the eyes of the world turned to the city for the 2008 Olympics. By this time air pollution deaths in China had reached more than 2 million a year, but a recent clean-up of industry and traffic has yielded rapid initial results.
Jakarta and Islamabad represent the trajectories of many developing nations with rapid urbanisation and industrial growth and without accompanying air pollution controls.
Data for the stripes came from the UK Met Office’s global climate models with adjustments from satellite observations that first became available around 1998. This adjustment was also applied past pollution, projected backwards to 1850 using fuel and energy statistics.
On their website, the team responsible observe: “Very few historical observations of PM2.5 exist before the year 2000 so instead we use data produced from a mix of computer model simulations and satellite observations. For the most recent years (2000-2021) we use a dataset that combines ground-level and satellite observations of PM2.5 concentrations from Van Donkelaar et at (2021, V5 0.1 degree resolution), this dataset can be found here.”


