NV Grid Works Smoothly with 50% Renewables.

Nevada’s grid would work smoothly and reliably while delivering 50 percent of the state’s electricity from clean, renewable energy sources like solar, geothermal, and wind according to an analysis conducted by the respected consultancy ICF. In November 2018, Nevadans passed a ballot measure (Question 6) by a 59/41 margin, which would require 50 percent renewables by 2030, confirming and formalizing public support for renewables. Nevada State Senator Chris Brooks has put forward legislation, Senate Bill 358, that updates and reforms the state’s existing renewable portfolio standard to match Question 6. As we demonstrated here and here, a 50 percent RPS would benefit Nevadans through cleaner air, increased clean energy investments, and thousands of new jobs. In this blog, we show that Nevada would maintain a reliable electricity grid with 50 percent renewables, adding to the evidence that state lawmakers should respond to the will of the voters and advance this popular policy.
Nevada’s grid is ready for 50 percent renewables
NRDC, NextGen America, and GridLab specified key assumptions and scenarios for an analysis conducted by ICF, an energy consulting firm whose clients include the U.S. Environmental Protection Agency and electric utilities across the country, to study whether the electricity systems in Nevada, Arizona, Colorado, and New Mexico would remain reliable if stronger renewable energy policies were enacted in all four states for the same time period. The result of the analysis indicates that Nevada can get half its power from renewables and keep the lights on and buildings running without a problem, even as its neighboring states are also choosing more renewables.
ICF performed a stress test of a highly-renewable Nevada electric system in 2030 to determine if the system would be able to meet the most extreme projected increases in demand, based on the power mix that ICF’s Integrated Planning Model found to be the most cost-effective way to meet a 50 percent RPS. The stress-test focused on the capabilities of the generating mix under local and regional transmission constraints and did not include a detailed transmission security analysis, which would stress-test the transmission system itself. (More details on IPM and the RPS modeling can be foundhere.)
The test focused on three different stresses to the grid, defined by three intensities of ramps—or increases in demand over a given time period. The length of time over which electricity demand increases is called a ramping period or interval. These intervals are significant because they indicate how quickly the grid needs to respond to meet changing demand and prevent outages. The study focused on net demand, the total electricity demand minus output from renewable energy sources. It estimated net demand by applying historical renewable generation patterns to their model’s projected renewable energy additions that were driven by the strengthened RPSs. Then, the study considered the maximum increases in net demand over three ramping intervals: 30 minutes, 3 hours, and the period with the largest increase in demand in any given day.
For each of these ramps, the study determined whether the dispatchable resources that remained in 2030 with a strengthened RPS would be sufficient to meet the increase in demand in the required time frame, considering the operating constraints of different resource types. It considered, for example, which power plants would be operating at the point of lowest demand, how much additional electricity those plants could generate, and how much time it would take for other plants to come online to meet demand. The resources that were able to meet ramps in demand were combined cycle gas plants, gas-fired combustion turbines, hydroelectric power plants, and pumped storage hydropower—all resources that exist today in the four states. The study used conservative assumptions, including modest additional battery storage deployment, no imports and exports out of the four states, and the largest projected ramps based on historical renewable generation output. Even so, the study found that the 50 percent renewables grid had enough flexibility to meet daily fluctuations in demand and keep the lights on across all four Western states, including Nevada.
The challenge: the sun and wind don’t work on demand
This kind of reliability testing is especially important when integrating variable renewable energy resources into the grid. Solar and wind energy resources (without storage) are variable and non-dispatchable, characteristics which can create challenges for grid operators to meet demand when these resources make up very high percentages of the generation mix, like 80 percent or above.
Solar panels and wind turbines are known as variable resources because their output is dependent on environmental conditions (the strength of the wind and sun), which vary on hourly, daily, weekly, and seasonal timeframes. This variation is highly predictable; powerplant operators have tools to predict electricity output based on weather forecasts. While no power plant is available all the time (and, in fact, fossil fuel-fired resources experience more unplanned loss of availability than wind and solar do), the resources we call variable have more uncontrollable—but still predictable—variation in their output than traditional power plants.
Because of the same dependency on environmental conditions, solar and wind resources are also considered non-dispatchable: that means they cannot be called upon—or “dispatched”—to meet demand for electricity in any given moment. This is in contrast to dispatchable resources, which can generate power when it’s needed, like gas-fired power plants, solar panels paired with large batteries, or some types of demand response.
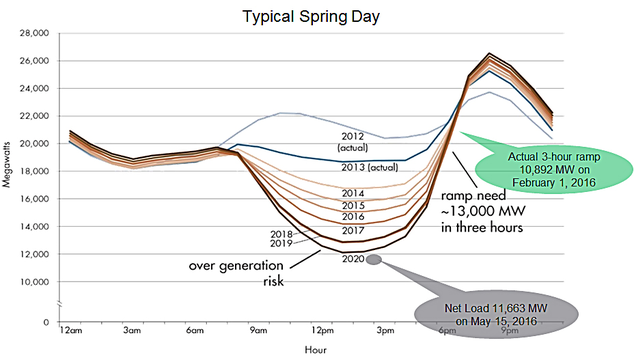
As more wind and solar resources enter the generating resource mix in any given state, their variability and non-dispatchability affect how the energy system meets demand. In Nevada, most or all of the new renewable energy will come from solar panels, which produce the most energy in the middle of the day when the sun is shining its brightest. As a result, net load—the electricity demand that remains after subtracting the output of wind and solar (i.e., the load that must be met by dispatchable resources)—will be lower during the middle of the day, leading to so-called “duck curve,” shown in the figure below. The “duck curve” shows how the need for dispatchable resources decline during the day, but then increases in the evening, as the sun goes down and people go home and turn on lights and appliances. In this high-solar future, dispatchable resources need to increase—“ramp up”—more quickly and more often, than they have in the past.

Illustrative duck curve: net load in California on a typical spring day
The ability to meet these ramps in demand is crucial to grid reliability; the electricity system must be able to handle increases in demand quickly enough to prevent any outages. That can be done in a variety of ways: firing up new gas-fired power plants, increasing the output of already-operating plants, discharging stored energy from batteries or other technologies, or using demand-response technologies that reduce peak energy demand or shift it to later in the day.
Nevada’s grid is up to the challenge
This analysis confirms that a 50 percent RPS will not only bring economic and environmental benefits to the Silver State—in the form of cleaner air and water, reduced climate-warming pollution, and good-paying jobs for Nevadans—but will also maintain an electricity grid that is reliable even under stressed conditions.
2 April 2019


