The first two series of PARIS REINFORCE infographics are out!
The H2020 project PARIS REINFORCE has just released its first two series of infographics, aimed at visualising in a user-friendly way key outputs of the project!
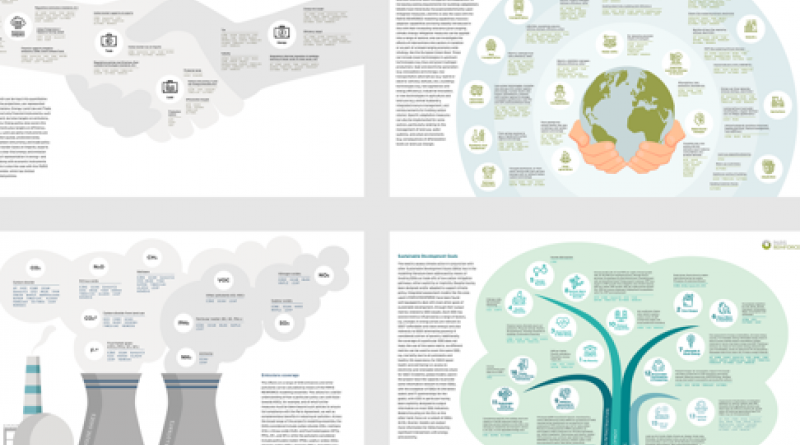
The first series of six infographics seeks to explain how different socioeconomic dimensions, policies, mitigation and adaptation technologies, greenhouse gas emissions and other pollutants, economic sectors, and Sustainable Development Goals are represented in climate-economy and energy system models. It also illustrates how the PARIS REINFORCE modelling ensemble covers each of these aspects!
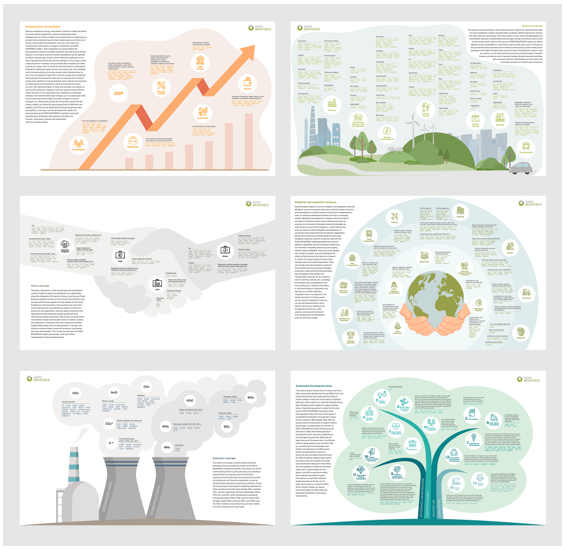
Of course, the I2AM PARIS open access, data exchange platform already hosts a dynamic documentation for all models of the PARIS REINFORCE consortium, plus non-consortium models of the integrated assessment modelling community. To view how different socioeconomic dimensions, policies, mitigation and adaptation technologies, greenhouse gas emissions and other pollutants, economic sectors, and Sustainable Development Goals are represented in each model, please visit the I2AM PARIS platform dynamic documentation, here.
The second series of seven infographics draws from the project’s socio-technical analysis activities, and illustrates in system maps the decarbonisation potential of different sectors in different countries, inside and outside Europe, and based on different or combinations of Systems of Innovation frameworks.
The first infographic builds upon the Multi-Level Perspective and further focuses on the phase-out of lignite in the Greek electricity mix. By delving into the landscape that established lignite as the mainstream energy resource in Greece, as well as the factors sustaining its dominance despite niche technologies and innovations challenging the regime, it discusses how the envisaged decarbonisation can be socially just and effective across multiple sustainability dimensions. For more information, please read our publication here
Then, two infographics, based on the Sectoral Innovation Systems approach, attempt to identify the elements enabling Norway to become one of the leaders in the diffusion of electric vehicles and the factors pacing down similar progress in Canada. Using the System Failure framework, bottlenecks hindering the decarbonisation of the transport systems are identified. Results indicate that the effectiveness of Norway’s policy is exaggerated and has led to recent spillover effects towards green shipping, while the activity of oil companies, regional and federal legislative disputes in Canada and the lack of sincere efforts from system actors to address challenges lead to non-drastic greenhouse gas emissions reductions, despite significant policy efforts. For more information, please read our publication here
In another comparative setting, two infographics review the energy-intensive iron and steel, cement and chemicals industries of the United Kingdom and Germany, two major emitting countries with significant activity, yet with different orientation recently. Based on the Sectoral Innovation Systems and the Systems Failure framework, they aim to capture existing and potential drivers of or barriers to diffusion of sustainable industrial technologies and extract implications for policy. A critical factor for the successful decarbonisation of German industry lies in overcoming lobbying and resistance to technological innovation caused by strong networks. By contrast, a key to UK industrial decarbonisation is to drive innovation and investment in the context of an industry in decline and in light of Brexit-related uncertainty. For more information, please read our publication here
Finally, another pair of infographics review the transport sector of Brazil and Argentina and the emergence of biodiesel. Using the Multi-Level Perspective and the Technological Innovation Systems, they shed light on the historical evolution of the dominant regime of the transport sectors of Brazil and Argentina and help understand how the dependency on fossil fuels was shaped in line with continuous pressures from oil, economic, and institutional crises from the landscape. They also highlight the emergence of the biodiesel technological system, its interactions with other technologies, and the progress that allowed it to break through from a niche and become part of the regime.
Visit the infographics section of our website and explore them!
PARIS REINFORCE