The rapid approach of the 1.5°C global warming threshold since the Paris Agreement
The Copernicus Climate Change Service (C3S) global temperature-trend-monitor application highlights a significant acceleration in global temperature rise since the adoption of the Paris Agreement. When the Agreement was approved in December 2015, the app projected that the 1.5°C threshold would be reached by March 2045. Today, a decade later, the benchmark is projected to be reached by May 2029. The app is a simple extrapolation of data and not a prediction tool — so its results should be interpreted with caution — it nevertheless illustrates the rapid increase in global temperatures since the Paris Agreement; a trend also reflected in key temperature datasets.
When COP delegates adopted the Paris accord ten years ago, the app estimated that the global temperature was already 0.98°C above the pre-industrial average and would breach the 1.5°C threshold in 2045. Today, the same tool estimates that we have reached a global average of 1.25°C and will be at 1.5°C over pre-industrial levels in May 2029. This is five years earlier than when we published the first version of this article in 2023.*
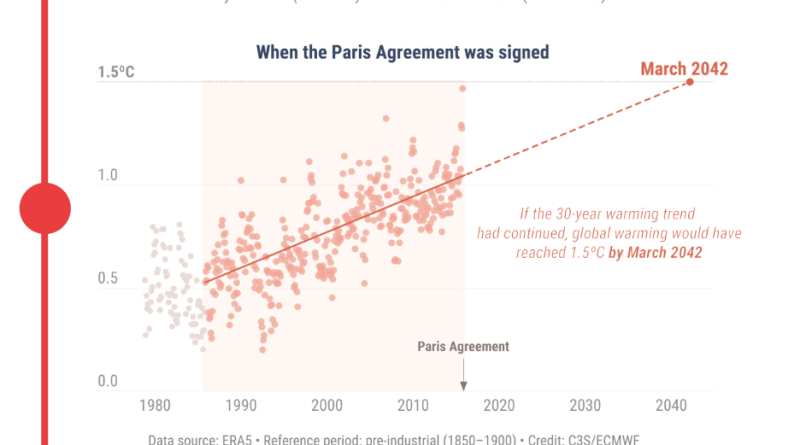
Before and after. In December 2015 when the Paris Agreement was signed, our C3S global temperature trend monitor app estimated that the 1.5°C threshold would be reached by March 2042. Today, on the 10th anniversary of its signature, the application estimates that the benchmark will be reached by May 2029. Use the slider to compare. Explore the app.
To put it another way, in 2015 our projected deadline for reaching 1.5°C was 27 years away. Now, the application estimates that the threshold is only 4 years away – 23 years closer. This striking change suggests that global warming has accelerated quickly in recent years. It is important to note, however, that the application is based on a simple linear extrapolation, which cannot distinguish between acceleration due to increased greenhouse gases and natural climate variability. Nevertheless, this basic projection offers a clear estimate of the rapid pace of warming.
The app leverages the C3S ERA5 dataset, utilising the time series of global surface air temperature and extrapolating the data with a simple linear regression to show when the central point may reach 1.5°C above pre-industrial levels in a 30-year average. The app also uses temperature data from climate projections to provide an illustrative buffer of uncertainty. The estimate is updated monthly.
Whilst we don't yet fully understand all the reasons behind the recent rapid increase in global temperatures, it is clear that the ever-growing concentrations of GHG in the atmosphere have worsened the situation, making the goal of keeping global temperature anomalies below 1.5°C above the pre-industrial average more difficult to achieve.
Greenhouse gas concentrations in the atmosphere, according to all expectations, will increase this year, as they have continuously reached new heights since global leaders committed to the Paris Agreement.
It’s not all bad news on the greenhouse emissions side; some sectors and regions have made considerable mitigation efforts. The Copernicus Atmosphere Monitoring Service (CAMS) provides near-real-time estimates of CO2 emissions for the European Union and the UK in partnership with Carbon Monitor. Some sectors have significantly reduced emissions, but these efforts haven’t translated into a deceleration in concentration increases.
Eventually, our 1.5°C app has also shown the astonishing broken records of the years 2023, 2024 and 2025, with a long streak of temperatures above 1.5°C marking the three warmest years on most global datasets, including C3S ERA5. This streak of records is also clearly visible in the Climate Pulse application.
The years since the Paris Agreement was signed have been the warmest in climate data records dating back to 1940, but the difference since 2023 stands out very clearly.
In our December 2015 monthly update, using a different climatology (1981-2010) as a reference, we considered the 12-month period as the warmest by a large margin. Since then, we have observed the warmest years on record in 2016, 2019, 2020, 2023 and 2024. This cascade of records is probably one of the most significant indicators that climate change is here, and the 1.5°C threshold is approaching quickly.
The apparent acceleration of global warming since the adoption of Paris Agreement is also reflected in key regulators of the temperature of our planet, such as sea ice and the oceans. The last three years stand out clearly also in terms of sea surface temperature, as shown in our Climate Pulse application.
The question of when we will have exceeded the long-term temperature objectives is still open within the scientific community. But the main datasets from different international organisations agree on the fast acceleration of the global warming trend in recent years.
In the end, calculating whether we reach 1.5°C in 2034 or 2036 is not that important. What matters is how rapidly we are approaching that threshold – a level of warming that will transform our climate.
The results of the first global stocktake show that the Parties’ pledges to reduce greenhouse gas emissions are very far from the objective to keep “a global average temperature rise this century well below 2 degrees” and "drive efforts to limit the temperature increase even further to 1.5 degrees.” The data is very clear: time is running out very quickly.
Cover photo: Copernicus Climate Change Service. Global Temperature Trend Monitor • Use the slider to compare