Fact-Check: will 2°C of global warming trigger rapid runaway feedbacks?
Claim: Once global warming reaches 2°C (which we’ve nearly reached already, but scientists are downplaying it), positive feedback loops and tipping points will trigger rapid runaway warming and guarantee apocalyptic climate change in the next few decades.
Reality: The risk of tipping points grows significantly above 2°C, but this is an uncertain precautionary boundary and not a sharp definite threshold. Most feedbacks are long-term, committing to a Hothouse by the year ~3000 rather than 2100. Current warming is 1.1°C above the 1850-1900 baseline, not ~2°C. The 1.5°C & 2°C targets are still geophysically possible, and reduce the risk of passing more tipping points.
This is the fifth post in a new climatetippingoints.info series fact-checking claims that various climate tipping points have been crossed, and that sudden & apocalyptic warming is now inevitable. See the Introduction post for an overview.
Recently there have been claims (e.g. 1,2,3,4) that if global warming reaches 2°C above the pre-industrial global average temperature, several positive feedback loops and tipping points will be abruptly triggered, guaranteeing runaway warming. On top of this, it’s also been suggested that we’re already closer to 2°C than scientists publicly admit (e.g. 5,6), that we’ve passed a global tipping point already (7,8), or that 2°C is already locked in anyway (9,10), meaning we will inevitably pass this ‘global tipping point’ and lock in 4°C of ‘catastrophic’ warming.
In this post of climatetippingpoint.info‘s Fact-Check series, we investigate whether 2°C really marks a definite global climate tipping point, and how close we may be to it.
Two what degree
A temperature increase of 2°C above the pre-industrial baseline has long been a pivotal number in discussions of global warming. It first emerged as a potential upper limit to “safe” warming as a hypothetical estimate by economist William Nordhaus in 1975. One of the earlier scientific reports on climate change found 1°C to be a safer limit, but decided that 2°C was more achievable and the next-best target. 2°C gradually became the focal point of international climate negotiations, culminating in the adoption of the Paris Targets in 2015 of a maximum of 2°C warming (and preferably less than 1.5°C).

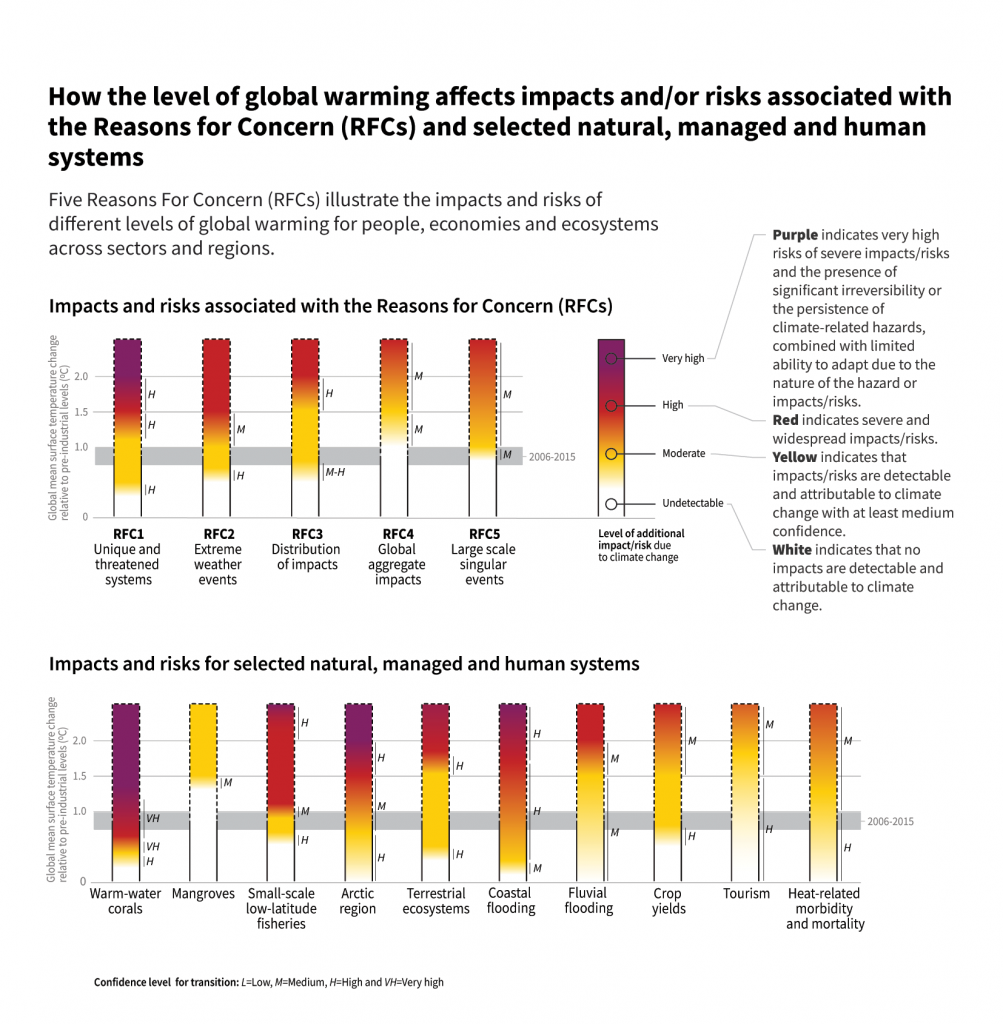
The recent IPCC special report on 1.5°C has since further shown that substantially more damage would occur by 2°C (shown by the bars above), which has led scientists and activists to concentrate on finding ways to remain within 1.5°C of warming within the short time-frame that this might still be possible.
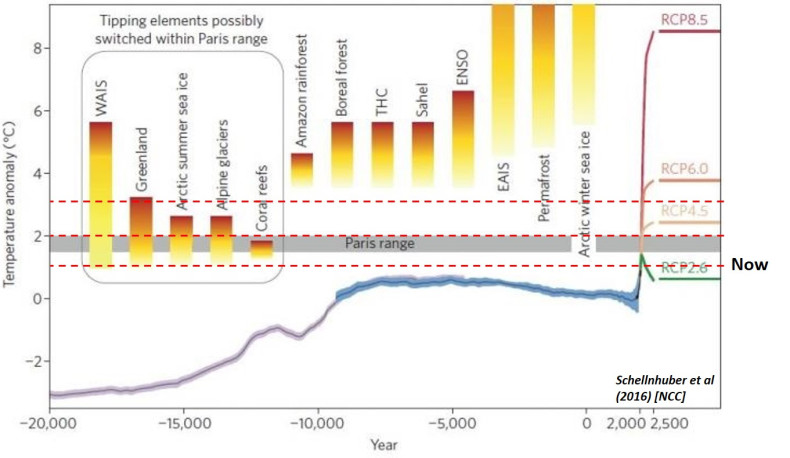
We can be sure then that 2°C would represent a dangerous level of warming with significant negative consequences for humanity. But the IPCC reports have not found evidence of a sudden increase in climate impacts at 2°C. For the most part, climate impacts are projected to scale fairly linearly with additional warming, with every increment above 1.5°C having a greater impact. For tipping points, the IPCC reports and other papers have found that the risk of passing tipping points emerges above 1°C, becomes moderate within the 1.5-2°C range, and high above 3°C (see above), but there isn’t a sudden switch-on of multiple tipping points at exactly 2°C. Instead, the 1.5 and 2°C targets are based on what scientists and diplomats have compromised on as levels of warming beyond which lies an unacceptable risk of damaging impacts on human society.
Hothouse Unearthed
Since the last big IPCC report (AR5) though, there have been increasing worries that various climate feedbacks and tipping points may happen sooner and more strongly than previously anticipated. Contrary to many people’s perceptions, the IPCC reports actually do recognise and incorporate many of these feedbacks* into their projections, including water vapour, sea-ice albedo, and weakening carbon sinks (*see e.g. IPCC AR5 pg 514+ & Fig 6.20; a full post on this will be published and linked here soon) . There are still some feedbacks (such as permafrost emissions, marine respiration, and ice sheet instability) that are not fully represented in models yet, but this is the result of a lack of sufficient understanding to be able to model them.
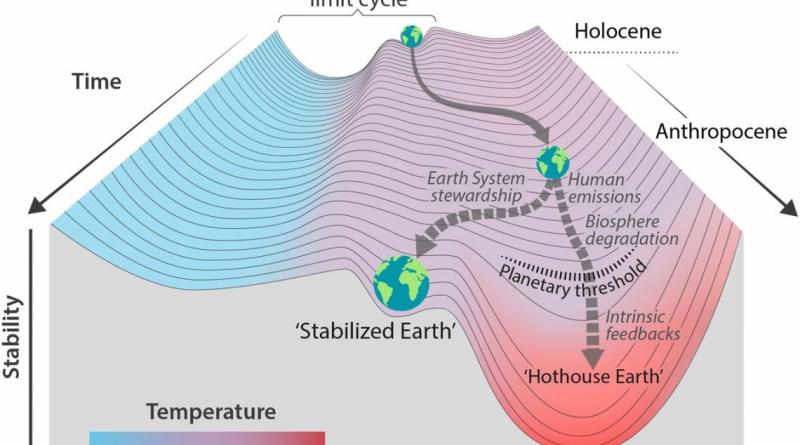
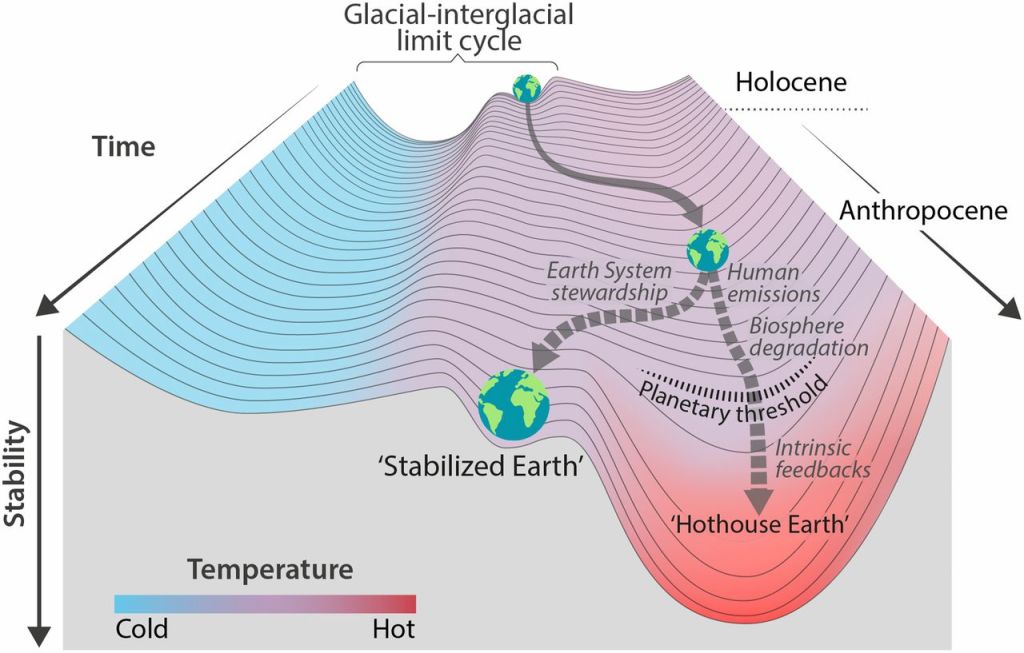
In August 2018, a perspectives paper – titled “Trajectories of the Earth System in the Anthropocene” but commonly referred to as Hothouse Earth – was published, which assessed the potential strength of some of these poorly-quantified feedbacks at 2°C of warming, and proposed that they could at some point be significant enough to risk triggering ‘tipping cascades‘. This is hypothesised to happen when one of these big tipping points commits us to extra warming, and then this extra warming is enough to trigger further tipping points, and so on.
The point at which the risk of such a ‘tipping cascade’ becomes significant was hypothesised to be around 2°C, above which feedbacks might eventually push warming to more like 4°C over hundreds to thousands of years – the “Hothouse Earth” trajectory. This would mean that even if we successfully reduced emissions and stabilised global warming at slightly above 2°C by 2100 (rather than our current likely trajectory of 3-4°C), Earth system feedbacks might push the Earth to 4°C in the long-run anyway. But if warming remained below 2°C, a “Stabilised Earth” pathway would still be possible instead.
This paper immediately triggered a lot of media coverage and public concern, and brought tipping points and feedbacks renewed attention. However, there were several nuances and caveats to this paper that were not so widely reported.
Firstly, it’s worth remembering that this was a perspectives / comment piece and not a full novel research article, and had the main goal of proposing a new hypothesis (of an inevitable long-term shift to hothouse conditions if temperatures stabilise above 2°C) rather than immediately proving it. The paper was the first major publication of a new project (the Earth Resilience in the Anthropocene (ERA) project; which – full disclosure – this article’s author Dr. David A. McKay is currently employed on), which has the goal of investigating these feedbacks and tipping points in more detail in order to test this Hothouse Earth Hypothesis. The figures used to illustrate the paper are schematic illustrations rather than direct results too, based on potential tipping point interactions and a hypothetical system stability landscape. There are now many new studies emerging that are investigating this hypothesis, but so far there has not been convincing proof of a global tipping point for as much as +2C of locked in warming.
Secondly, the 2°C limit was proposed more as an uncertain precautionary boundary rather than a definite sharp transition. Much like the Planetary Boundaries concept, the 2°C limit was chosen as a precautionary guardrail (in their own words: “taking a risk-averse approach“), after which the risk of increased feedbacks and tipping points interacting grows if temperatures remain above it long-term. For example, IPCC reports and other papers have found that the risk of passing tipping points emerges above 1°C, becomes moderate within the 1.5-2°C range, and high above 3°C (as shown earlier). However, these risks remain uncertain, and we don’t yet have enough evidence to establish what temperature might trigger a Hothouse trajectory (in their own words: “Precisely where a potential planetary threshold might be is uncertain“). We may well end up finding the Hothouse commitment temperature is higher or maybe even lower than 2°C, or that there’s no clear threshold at all. But this uncertainty is all the more reason to strive for stabilising by 1.5°C rather than 2°C by 2100 just in case, and if possible then gradually reducing this warming down over subsequent centuries to counteract longer term feedbacks.
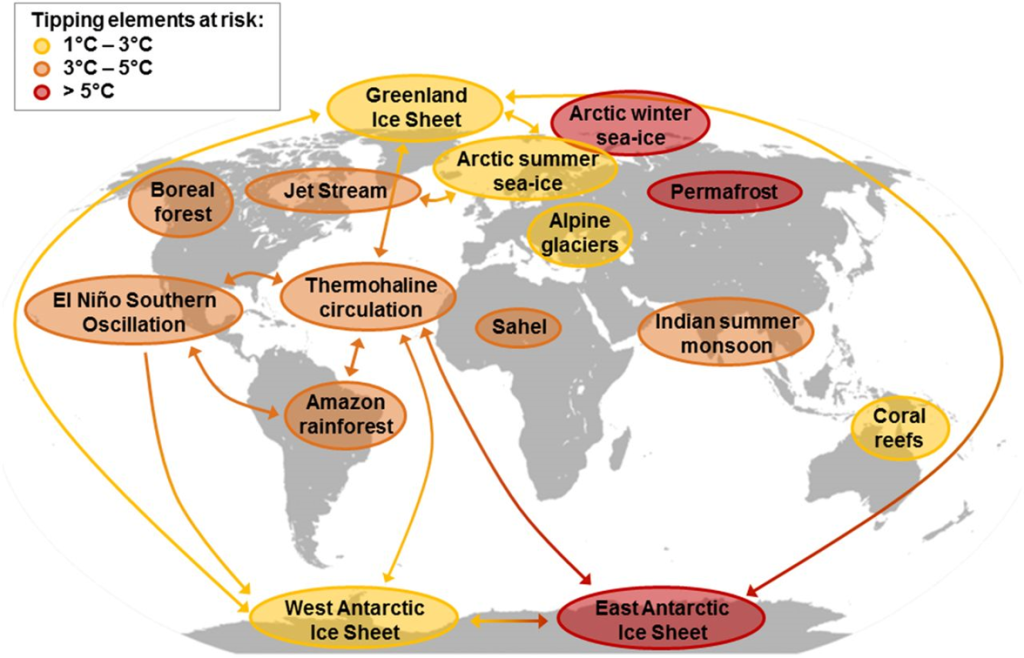
Thirdly, many of the feedbacks in the Hothouse Earth pathway are long-term, committing us to a Hothouse state in several centuries’ time rather than over the next few decades. Several tipping elements in the cascade figure above (e.g. ice sheets & the thermohaline circulation) will take centuries to millennia to complete their transitions even if tipped soon, while some of the others (e.g. permafrost thaw and Amazon/Boreal forest dieback) will still take decades to centuries. Stability of both the Greenland and West Antarctic Ice Sheets is projected to be at risk of tipping above 1.5-2°C (often mistakenly cited as evidence for a generic global tipping point rather than ice-specific). This would guarantee the eventual collapse of these ice sheets, and parts of West Antarctica may have already crossed this point. But ice sheets are so massive that this will still take far longer than our lifespans to play out. The Hothouse Earth trajectory also assumes temperatures stabilise and remain above these limits long-term – if we were to overshoot 2°C for a few decades but successfully draw down enough carbon to go back below, this might still stop these processes early enough to prevent a total collapse.
Finally, some of the coverage used the term “runaway warming” to describe the Hothouse Earth trajectory, but this is inaccurate. Runaway warming in scientific terms means when positive feedbacks surpass all negative feedbacks and uncontrollably amplifies warming until all water evaporates, creating a ‘moist greenhouse’ as likely happened on early Venus. But this is not what the Hothouse Earth paper is proposing – instead they are suggesting that there is an alternative stable climate state at around 4°C warmer than pre-industrial (shown in the stability landscape figure earlier on), and that the 2-4°C range is inherently unstable and leads to the Earth warming until it reaches this state. But this new state is potentially quite stable (as in the stability landscape image), and warming beyond it is unlikely without substantial further emissions. As the greenhouse effect is logarithmic (i.e. each 100ppm extra CO2 causes less warming than the 100ppm before) the effectiveness of positive feedbacks is gradually curtailed. True ‘runaway warming’ would take far more emissions (and probably much more than we are actually capable of) to surpass this, and so accelerating warming does not imply runaway warming that continues indefinitely. And even if people saying runaway is likely don’t mean a true Venusian runaway, the term still implies that a large amount of warming will soon become unstoppable, which calculations of feedback and tipping point impacts currently indicate is very unlikely.
If the Hothouse Earth Hypothesis is correct then, stabilising at or above 2°C would lead to a gradual but inevitable drift up to 4°C by say the year ~3000, making the 2-4°C range impossible to remain stable in on long timescales. What it doesn’t mean is sudden runaway feedbacks kicking in as soon as temperatures hit 2°C and then pushing us to a Hothouse within a few decades – it simply guarantees a long-term commitment to gradually shifting to a Hothouse state. There is also not yet sufficient evidence to back the hypothesis up, and so it remains only a theoretical possibility. However, we should of course strive hard to avoid a Hothouse world of 4°C and 10+ metres of sea level rise in the year 3000 anyway, for the sake of those in the future!
Shifting Baseline Syndrome
On top of this, it’s also sometimes then claimed that temperatures are actually far closer to (or even more than) the 2°C limit than scientists admit. If one assumes 2°C is a catastrophic ‘global tipping point’, it means that apocalyptic runaway warming is already imminent. For example, the main image below circulated online during 2019, claiming it’s evidence for more than 2°C of warming so far and so the Paris target has been broken already:
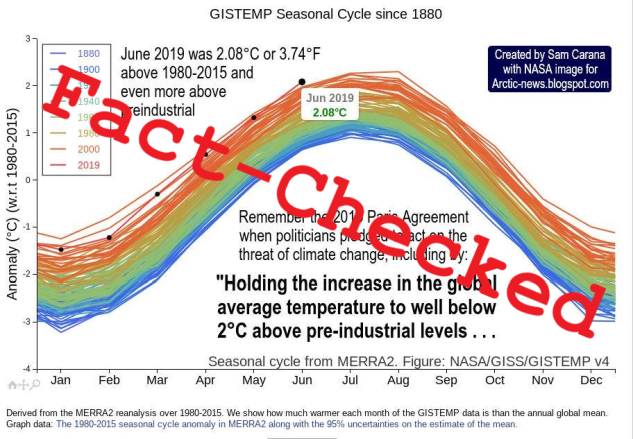
The original graph shows the seasonal cycle of global temperatures compared to the whole-year average, with summers about 2°C warmer than the yearly average and winters about 2°C colder. But over time the yearly average has moved up due to global warming, which can be seen as the upwards shift from the blue to the red curves above. June 2019 was a record for June warmth, coming in as 2.08°C above the 1980-2015 average yearly temperature. However, the image above mistakenly interprets this 2.08°C as being the total increase in global warming, when it’s actually just between that June and the whole-year average. Given each month’s temperature is shown relative to the yearly average we’d expect summer* months to be warmer than the year-average and winter* months cooler even back in 1880, leading to the seasonal wave pattern (*the northern hemisphere has much more land so its seasonal cycle dominates).
The actual global warming signal shown here then is the shift up in the yearly average, with the summer difference from the 1980-2015 average growing from around +1 to +2°C (i.e. a warming of about +1°C). That’s also why winter comes out colder than the global average for the year (otherwise the image author’s interpretation would imply a significant global cooling trend every winter). This shows that global warming is pushing the whole seasonal cycle upwards in this graph, so far by around 1°C. This can be seen in the other data above as well, which shows June 2019 was especially warm in Europe (more than 2°C above 1980-2000, and more than 3°C above pre-industrial) but that the global average was more like 0.5°C above 1980-2015 (or ~1.1°C above the pre-industrial baseline that the Paris Targets are measured from).
Others have shifted the pre-industrial baseline earlier in order to show global warming as greater than 1.1°C. But choosing a different pre-industrial baseline doesn’t change the absolute temperature of where tipping points and impacts happen, it merely changes their position relative to the baseline. As a result, dropping the baseline by 0.1-0.4°C doesn’t make a Hothouse Earth tipping point 0.1-0.4°C closer, as the Hothouse Earth 2°C boundary is defined relative to the IPCC’s 1850-1900 baseline. Similarly, a “leak” from the IPCC that some suggested meant we were already at 1.4°C was actually just for land temperatures, which are already known to be more than the global average (and the latter is what climate impacts and tipping points are defined relative to). Finally, it’s also been claimed that climate lags and declining aerosol emissions means at least 2.5°C is already locked in anyway, but these claims rely on overestimates with the actual best estimates not yet adding up to 1.5°C.
The fact remains that as of 2019 we’re still about ~0.8-0.9°C away from the main Paris Target (of 2°C relative to 1850-1900 baseline) and ~0.4°C away from the safer Paris Target (of 1.5°C relative to 1850-1900 baseline). Although there are some feedbacks and warming commitments in play, these are not yet enough to break through either target, meaning that if rapid emissions reductions were to begin immediately the Paris Targets are still geophysically possible. That makes breaching 1.5 or 2°C a political choice rather than an inevitability.
Summary
In summary, although it is likely that feedbacks and tipping points beyond 2°C of warming will amplify and worsen warming and could hypothetically commit us to a “Hothouse Earth” state in the long-run, there is not yet any evidence to suggest this will happen at exactly 2°C or will trigger a rapid runaway process. The 2°C threshold in the Hothouse Earth paper was proposed as precautionary boundary with growing but uncertain risks of amplifying feedbacks beyond, rather than a sharp definite threshold. And the feedbacks driving the Hothouse Earth trajectory would take centuries and millennia to play out, committing us to a Hothouse world of +4°C and 10+ metres of sea level rise by the year 3000 rather than by 2100. However, if we carry on emitting on our current emissions trajectory we could end up nearing 4°C by 2100 anyway even without tipping points. Current global warming is at ~1.1-1.2°C, and even accounting for baseline choice and warming commitments it’s still geophysically possible to keep within the 1.5°C and 2°C Paris Targets. Some tipping points (like some ice sheets) may well be crossed soon, but striving to keep within 1.5°C gives us the best chance of avoiding passing any more tipping points that might commit the year 3000 to being a Hothouse world.
~
This post was written by Dr. David A. McKay, currently a Postdoctoral Researcher at Stockholm Resilience Centre (Stockholm University), where he is part of the Earth Resilience in the Anthropocene Project (funded by the European Research Council) and is researching non-linear climate-biosphere feedbacks. This post was written in his spare time with no funding support for this site.
Update log: 20/5/20 with new study links and clarification on runaway warming terminology.
Climate Tipping Points


