The Opportunity Costs of Germany’s Hydrogen Backbone
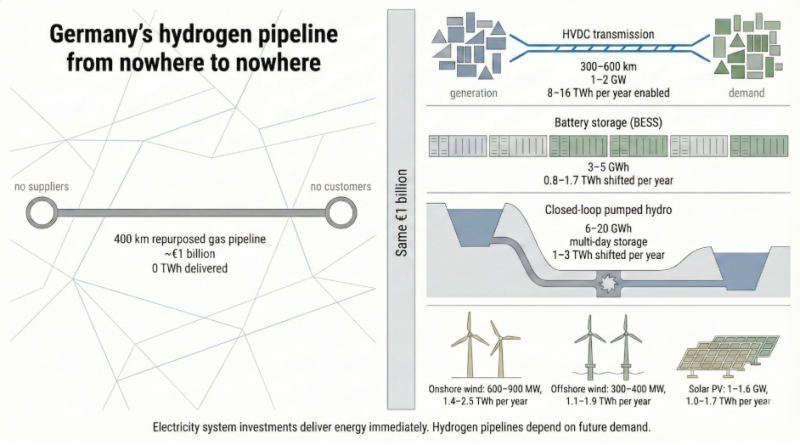
Germany has now completed and pressurized roughly 400 km of hydrogen backbone pipeline with no connected suppliers and no contracted customers, a pipeline from nowhere to nowhere. The infrastructure exists and is operational, but no hydrogen is flowing to anyone who has agreed to pay for it. This is not an early commissioning mismatch. It is the visible result of a broader European assumption that building hydrogen infrastructure ahead of demand would cause that demand to appear. The central issue is not hydrogen itself, but the opportunity cost of committing capital to assets that do not deliver usable energy outcomes.
Converting a high pressure natural gas pipeline to hydrogen service is not a simple matter of changing the label on the asset. The pipe must be inspected in detail for hydrogen embrittlement risk, weld quality, and material compatibility, with sections that fail testing either relined or replaced. Internal polymer lining is often required to limit hydrogen permeation and leakage, adding material and installation cost over long distances. Valves, seals, and gaskets throughout the system must be replaced with hydrogen compatible components, while metering and odorization systems are redesigned for a different gas with different safety characteristics. Compressor stations require major modification or full replacement, since hydrogen’s lower molecular weight and higher compression ratios demand different impellers, higher shaft speeds, and increased energy input per unit of delivered energy. Additional sensing and monitoring infrastructure is installed along the route, including high sensitivity hydrogen leak detection, continuous pressure monitoring, and upgraded control systems, all of which add capital and operating cost.
While operators have not published a project specific figure for the 400 km conversion, spreading the roughly €20 billion projected cost of the hydrogen backbone across its planned length implies conversion costs on the order of €2 million per km on average, placing this single segment in the vicinity of €0.8 billion to €0.9 billion. Even if actual costs for this section ultimately come in below that average, the scale of expenditure required to make legacy gas infrastructure hydrogen ready underscores how much of the backbone budget is being committed to preparation rather than to delivering energy to paying customers.
To make the opportunity cost concrete, it helps to normalize everything to a €1 billion unit of capital, roughly the likely cost of the 400 km segment. €1 billion is large enough to build system scale infrastructure and small enough to scale intuitively. When invested in electricity transmission, €1 billion typically builds between 300 km and 600 km of overhead high voltage direct current line, or 150 km to 250 km if undergrounding is required. A single modern HVDC corridor moves 1 GW to 2 GW continuously, enabling 8 TWh to 16 TWh per year of electricity flow. Transmission does not generate energy, but it immediately unlocks generation that already exists, reduces curtailment, lowers redispatch costs, and narrows regional price spreads. Over a 40 year operating life, a single corridor enables hundreds of TWh of energy to reach demand. Every MWh extra that transits the system reduces the cost of every other MWh due to the magic of high utilization for capital assets.
Storage is the next system layer that converts existing generation into usable electricity when and where it is needed. At late 2025 European market prices, €1 billion invested in grid scale battery energy storage installs roughly 3.3 GWh to 5.0 GWh of capacity, corresponding to 830 MW to 1,250 MW of four hour dispatchable power. These systems typically cycle 250 to 350 times per year in Germany, shifting 0.8 TWh to 1.7 TWh annually from low value periods into high value periods. Batteries reduce curtailment, replace gas peakers, stabilize frequency, and respond within milliseconds. Over a 15 to 20 year life, cumulative shifted energy is on the order of 12 TWh to 25 TWh, delivered within existing market structures. Battery energy storage systems are colocated with renewables farms and at key grid congestion chokepoints whenever possible, once again reducing curtailment and maximizing system value
Closed loop off river pumped hydro provides a complementary form of storage focused on duration rather than speed. For €1 billion, typical projects deliver 500 MW to 800 MW of power capacity with 6 GWh to 20 GWh of storage, often corresponding to 8 hours to more than 24 hours of discharge. These facilities cycle less frequently than batteries, usually 100 to 200 times per year, but they move much larger volumes per cycle, shifting 1 TWh to 3 TWh annually. With asset lives of 60 to 100 years and periodic refurbishment, lifetime energy shifting reaches 80 TWh to 200 TWh. Pumped hydro anchors high renewables systems, covers wind droughts, and does so without fuel risk or material degradation.
To forestall the inevitable chorus of complaints that arise whenever I mentioned pumped hydro, this is closed loop, off river pump hydro. The map view above is the available paired reservoir sites for that form of pumped hydro from the Australian National University global greenfield pumped hydro atlas. These sites are not on a river, not impacting fish, not impacting irrigation, not impacting silting in rivers or streams and with very limited environmental impact. Second, I’ve already mentioned transmission and batteries, complementary technologies that enable pumped hydro to do what it’s very good at, storing rather absurd amounts of electricity and delivering it into the transmission system. Third, for people who say that there are no sites for it, look at the map. There are 100 times the capacity compared to the requirement, hence only 1% need to be viable. Fourth, these are only sites of 400 meters or more elevation difference that are not on protected land with reservoirs horizontally close to one another that are close to existing transmission. Fifth, for anyone who mentions Snowy River 2.0, please understand that’s a failed megaproject that happens to be pumped hydro, not representative of pumped hydro. Sixth, it’s always worth asking what China is doing. It has 365 GW of power capacity, likely 14 TWh of energy storage capacity, of pumped hydro in operation, under construction or planned to start construction by 2030. When China is going that big on something and it’s not being done in much of the rest of the world, perhaps the rest of the world should pay attention.
Once transmission and storage are in place, generation capital converts cleanly into delivered electricity rather than curtailed output. €1 billion invested in onshore wind typically installs between 625 MW and 900 MW, depending on site quality and grid connection costs. In Germany, that capacity produces roughly 1.4 TWh to 2.5 TWh per year. Construction timelines are two to four years including permitting, and over a 25 year life cumulative generation reaches roughly 40 TWh to 60 TWh. Onshore wind is among the fastest ways to add large volumes of low cost energy, provided the grid can accept it.
Offshore wind follows the same pattern at a different scale. At current European costs of roughly €2.5 million to €3.5 million per MW, €1 billion installs around 285 MW to 400 MW of capacity. With capacity factors between 45% and 55%, annual output is 1.1 TWh to 1.9 TWh. Over a 30 year life, cumulative generation reaches roughly 35 TWh to 55 TWh. Offshore wind aligns better with winter demand and provides predictable output, but it depends heavily on transmission buildout to deliver that power inland.
Solar photovoltaic is the cheapest and fastest generation option, but also the most sensitive to grid and storage constraints. At €0.6 million to €0.9 million per MW installed, €1 billion buys 1.1 GW to 1.6 GW of utility scale solar in Germany. With capacity factors around 10% to 12%, annual generation is 1.0 TWh to 1.7 TWh and lifetime output over 25 to 30 years is 25 TWh to 45 TWh. Without sufficient transmission and storage, a growing share of that output is curtailed or depressed in value during midday hours.
These comparisons point to a consistent hierarchy. Transmission and storage unlock value from existing and future generation, reduce curtailment, and stabilize prices. Generation delivers its full value only when those system layers are present. All of these investments convert capital into measurable energy outcomes within years, not decades, because demand already exists and markets are functioning.
The hydrogen backbone followed a different logic. Planning assumed that distributed hydrogen demand would emerge across multiple sectors and that pipelines would catalyze that demand. Infrastructure was sized to modeled projections rather than to contracted offtake. Unlike transmission, which is justified by observed congestion and load, or storage, which is justified by price volatility and curtailment, hydrogen pipelines were justified by expectations of future behavior.
The arithmetic that undermined those expectations was straightforward. Delivered green hydrogen costs in Europe remain in the €8 per kg to €12 per kg range under realistic assumptions. Direct electrification at €0.15 per kWh to €0.25 per kWh remains cheaper and more efficient for most uses, and Germany’s new €0.06 industrial electricity rate is cheaper than natural gas, never mind vastly more expensive hydrogen. Compression, storage, and leakage further erode competitiveness. As a result, hydrogen demand remains concentrated only in narrow industrial niches where molecules are unavoidable.
Financing structures masked this risk. Hydrogen backbone costs were placed into regulated asset bases, ensuring recovery through network charges regardless of utilization. This reduced pressure to secure binding commitments and shifted long term risk to ratepayers. In contrast, generation, storage, and merchant transmission face stronger discipline from markets and offtake contracts.
When the full hydrogen backbone budget of roughly €20 billion is scaled using the €1 billion benchmarks, the opportunity cost is stark. That capital could have built multiple HVDC corridors, large portfolios of batteries, several long duration pumped hydro facilities, and tens of gigawatts of wind and solar. Over 30 years, those assets would have delivered hundreds of TWh of electricity, reduced fossil fuel imports, and lowered system costs. Instead, much of that capital is tied up in infrastructure that currently delivers zero TWh.
This pattern reflects a deeper policy issue. Europe’s energy transition bottleneck is spatial mismatch, not lack of generation technology or molecules. Underinvestment in transmission and storage increased curtailment and price divergence. Hydrogen pipelines attempted to bypass these constraints instead of resolving them. The result is infrastructure that exists without a market.
China provides a useful contrast. Chinese hydrogen pipelines are typically point to point connections serving existing industrial demand, sized to known loads and backed by contracts. They resemble transmission in their logic. Hydrogen can make sense when treated this way. It struggles when treated as a universal carrier.
The lesson is not to abandon hydrogen, but to apply the same discipline used elsewhere in the power system. Demand led planning, staged investment, and exposure to utilization risk produce infrastructure that earns its keep. Transmission and storage strengthen markets immediately. Generation follows. Public capital works best when it moves energy, not assumptions.
Cover photo: Google Gemini generated this infographic contrasting the immediate energy delivery of electricity system investments with a currently unused hydrogen pipeline, both costing ~€1 billion.