2019 in Review: U.S. Climate Rankings.
NOAA released the U.S. climate data for 2019. It was the second-wettest year on record with temperatures above average, wrapping up the warmest decade on record.
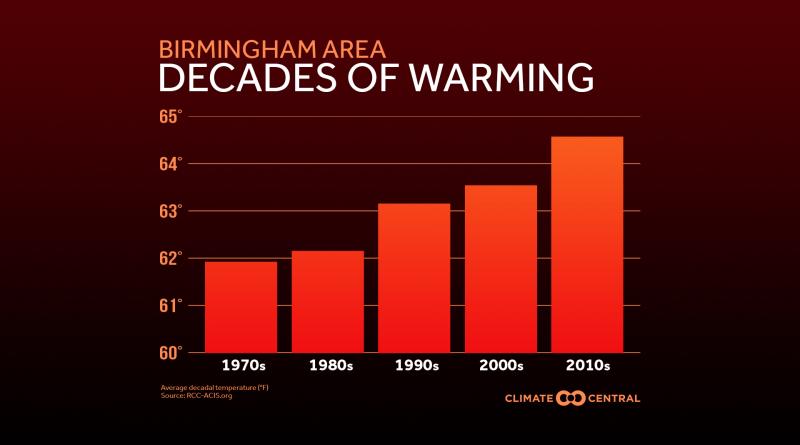
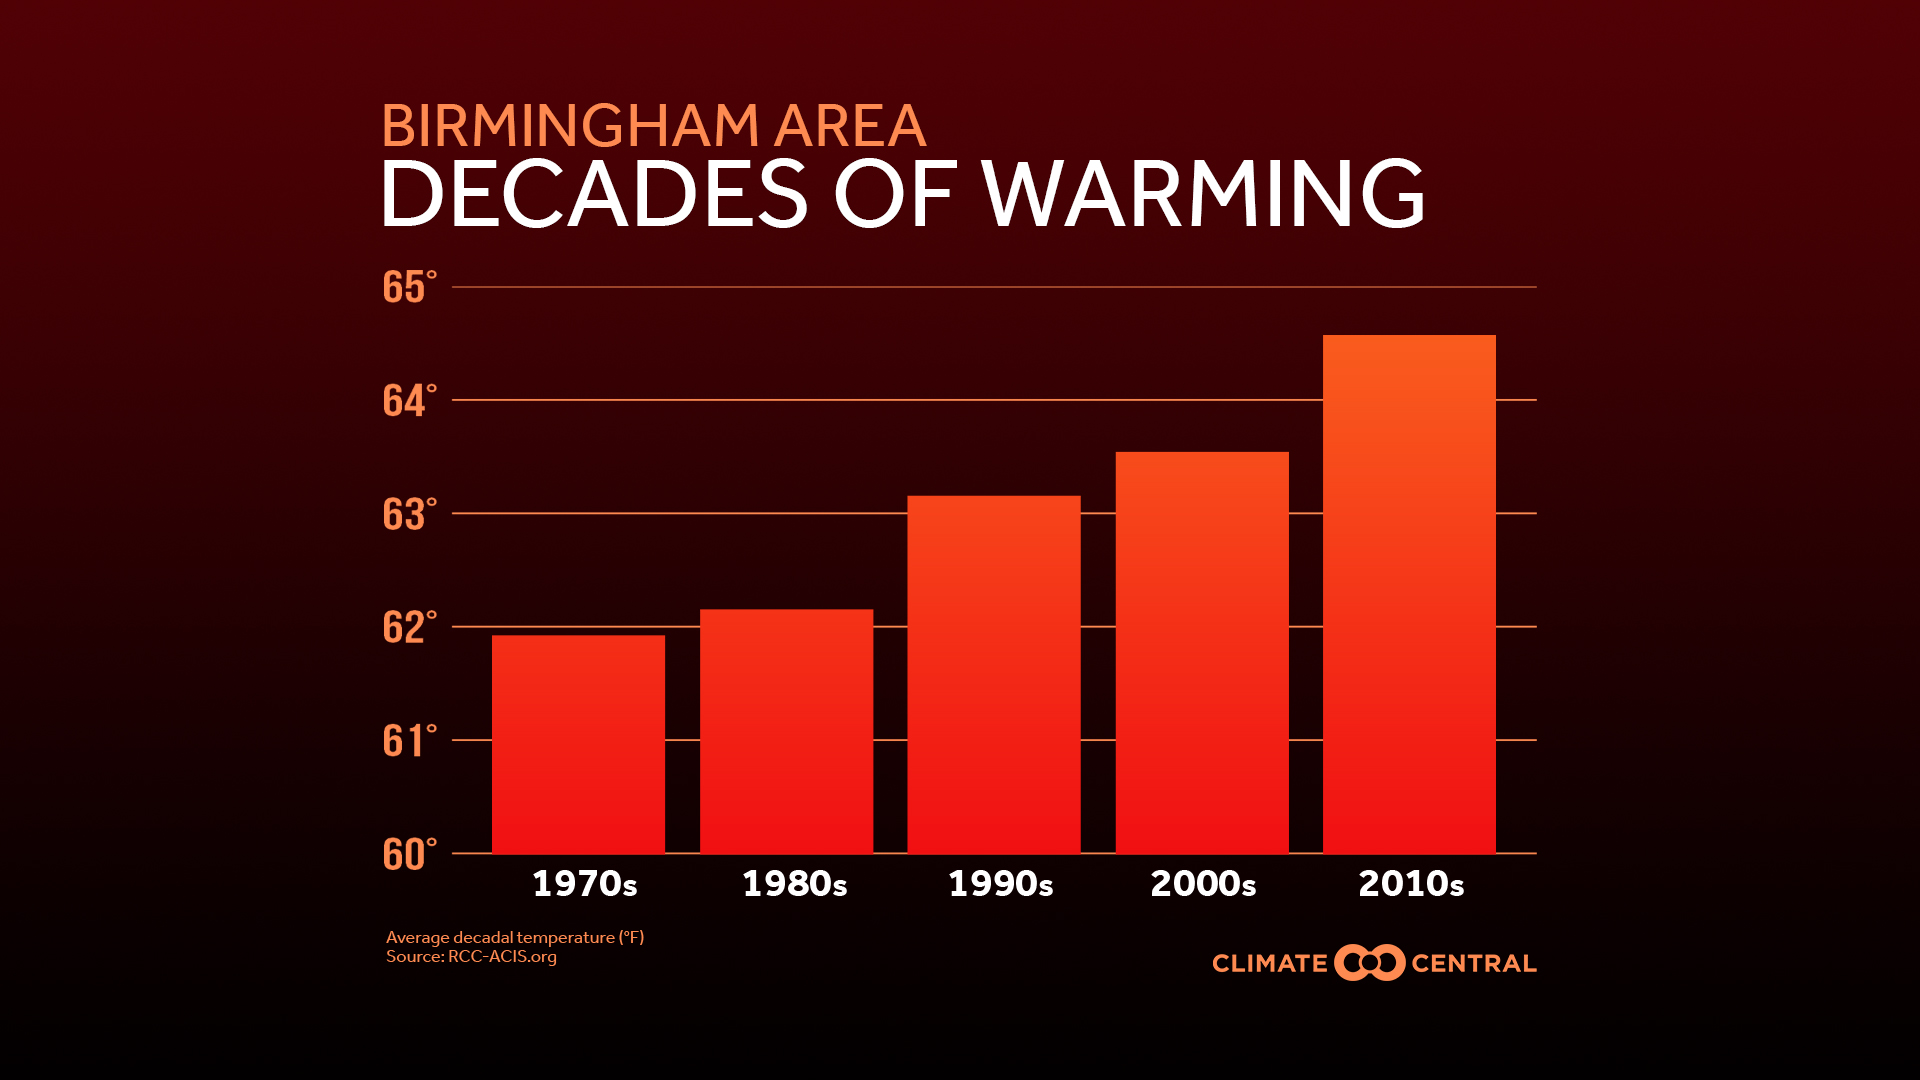
The nation’s year-end climate numbers are in. 2019 was the second-wettest year on record in the U.S., and temperatures were above average despite regions that were among the only cool spots on the planet. 2019 also concluded the warmest decade on record—the 2010s were the warmest of the past five decades for 87% of the 244 cities analyzed. Here’s a recap of the year’s U.S. climate rankings, before global statistics are released next week.
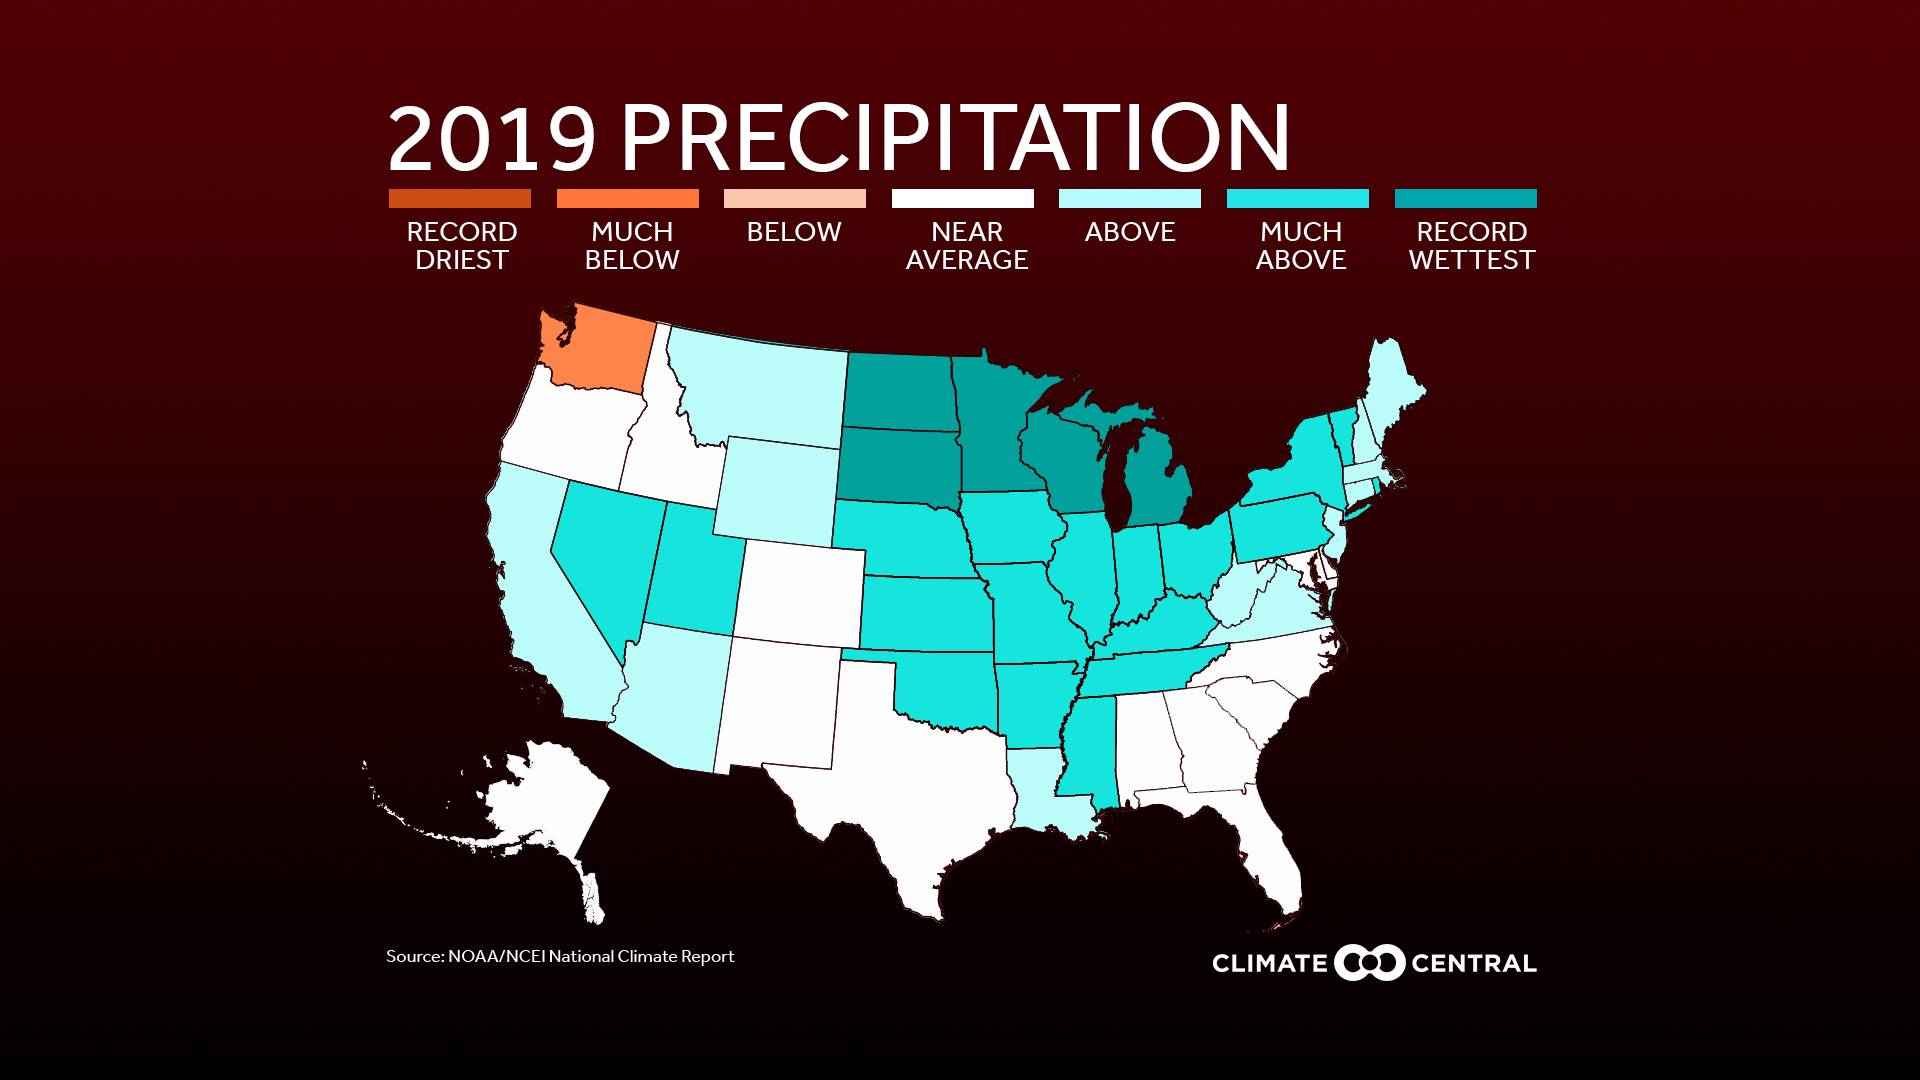
Rain was the defining story of the year—again. Nationally-averaged precipitation missed the previous record by 0.18 inches, bumping 2018 to 4th-wettest in the 125-year dataset. Five states experienced their wettest year on record, while another 18 finished the year in the top ten. Rainfall was most extreme in the Upper Midwest and Mississippi River basin, where months-long floods cost billions of dollars in damage to farms and homes. While climate change has a mixed effect on overall precipitation, heavy rain is intensifying as rising temperatures evaporate more water into the atmosphere.
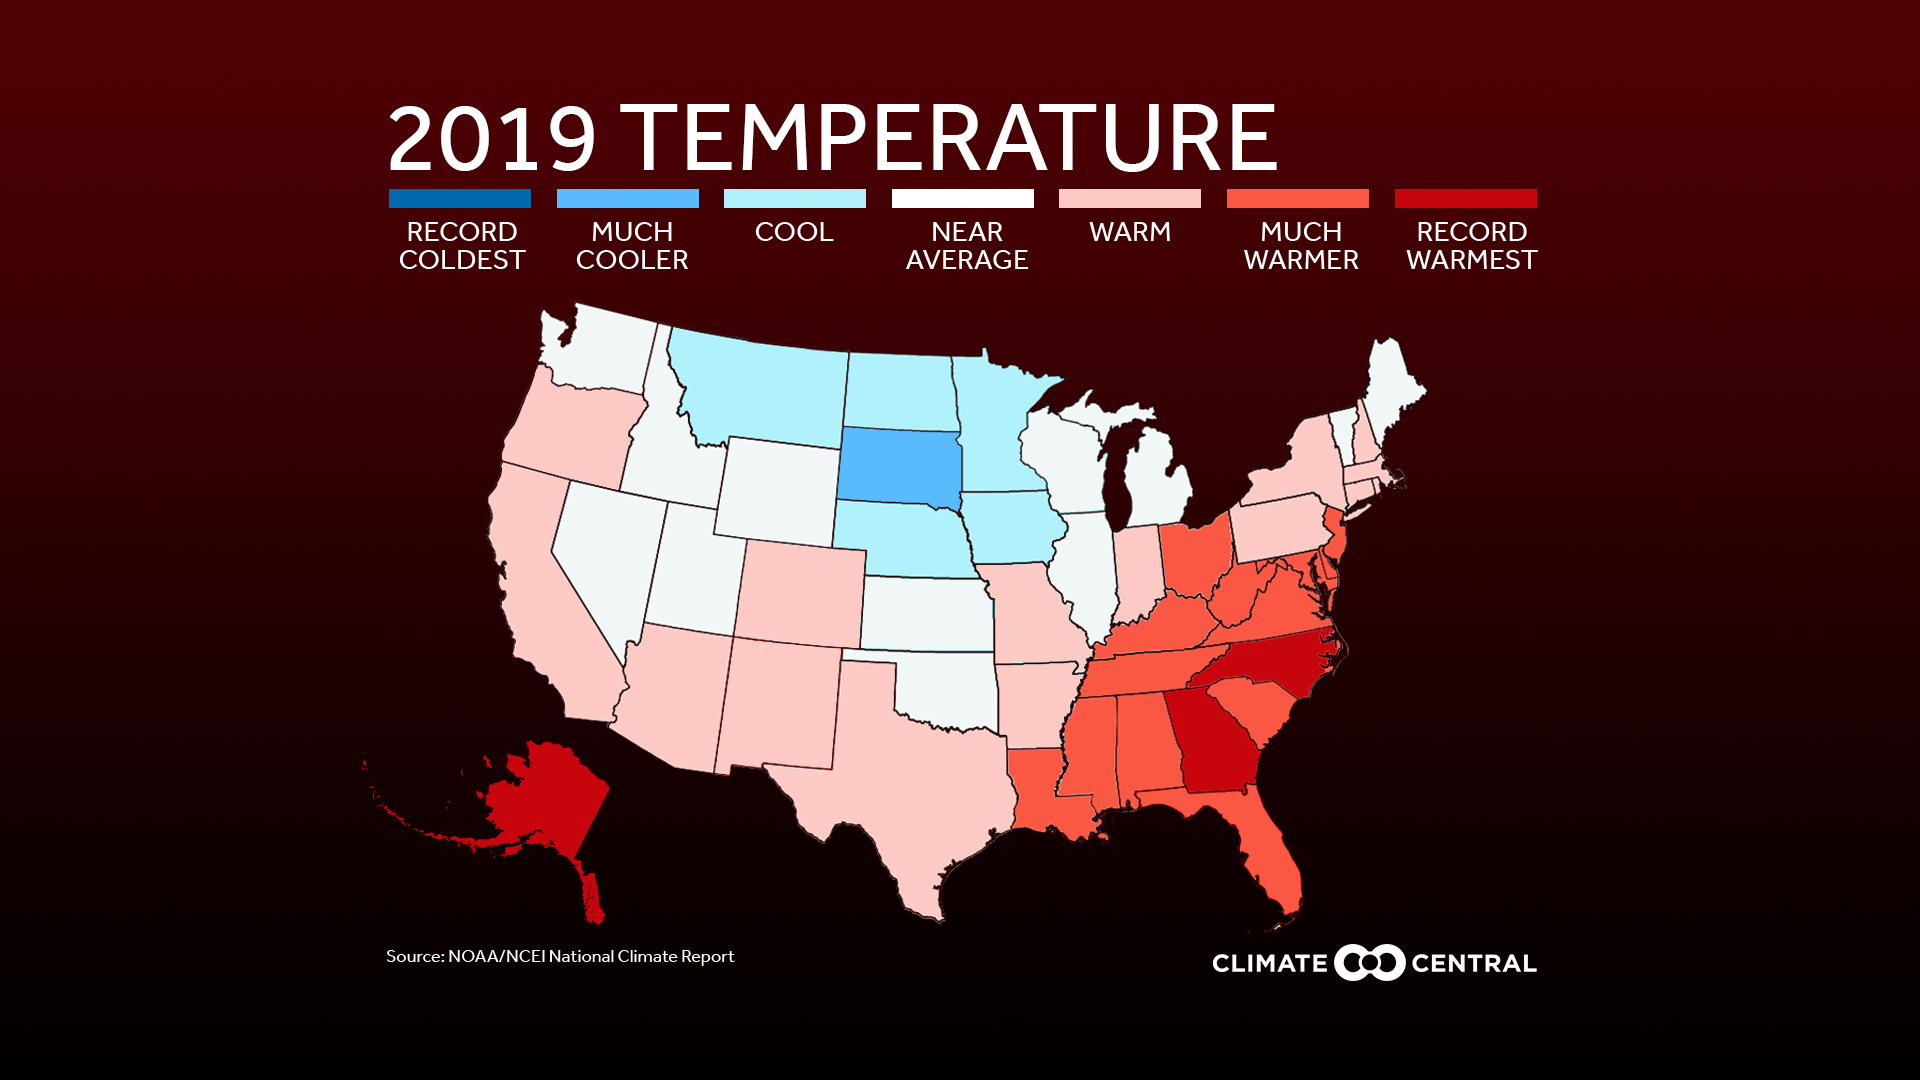
U.S. temperatures weren’t as scorching as the rest of the globe, but some regions still took the heat. Alaska set a new annual temperature record after historic highs of 90°F in Anchorage and historic lows of Arctic sea ice extent. North Carolina and Georgia also experienced their hottest years on record, and three other states were second-hottest. Seventeen states had one of their 10 hottest years, while none had one of their 10 coldest. Interestingly, the NOAA report shows that nightly minimums were more above-average than maximum temperatures. This follows a long-term trend: according to meteorologist Guy Walton’s database, record-high minimums outnumbered record-high maximums by 34% in the 2010s.
Of course, rising temperatures aren’t just statistics—they can intensify extreme weather events that affect lives and damage economies. NOAA reports that 14 such events cost the U.S. more than $1 billion in 2019. None were cold-weather related; all came from flooding, fires, or storms. It was the fifth straight year with at least 10 billion-dollar weather and climate disasters; only four of the previous 35 years had recorded that many. As climate change strengthens hurricanes, lengthens wildfire seasons, and intensifies heavy rain, these costs may continue to rise—unless we rapidly reduce the emissions that warm our planet.
METHODOLOGY: Average decadal temperatures (1970s - 2010s) for 244 cities were calculated using data from the Applied Climate Information System. Decades with five or more years of insufficient daily data (>10% missing) were excluded from this analysis. State data in the National maps are from NOAA/NCEI’s National Temperature and Precipitation Maps.
8 January 2020
CLIMATE CENTRAL


