Copernicus: 2020 warmest year on record for Europe; globally, 2020 ties with 2016 for warmest year recorded
Latest data released by the Copernicus Climate Change Service show that globally 2020 was on par with the warmest year ever recorded, marking the end of the warmest decade on record, while CO2 concentrations continue to rise.
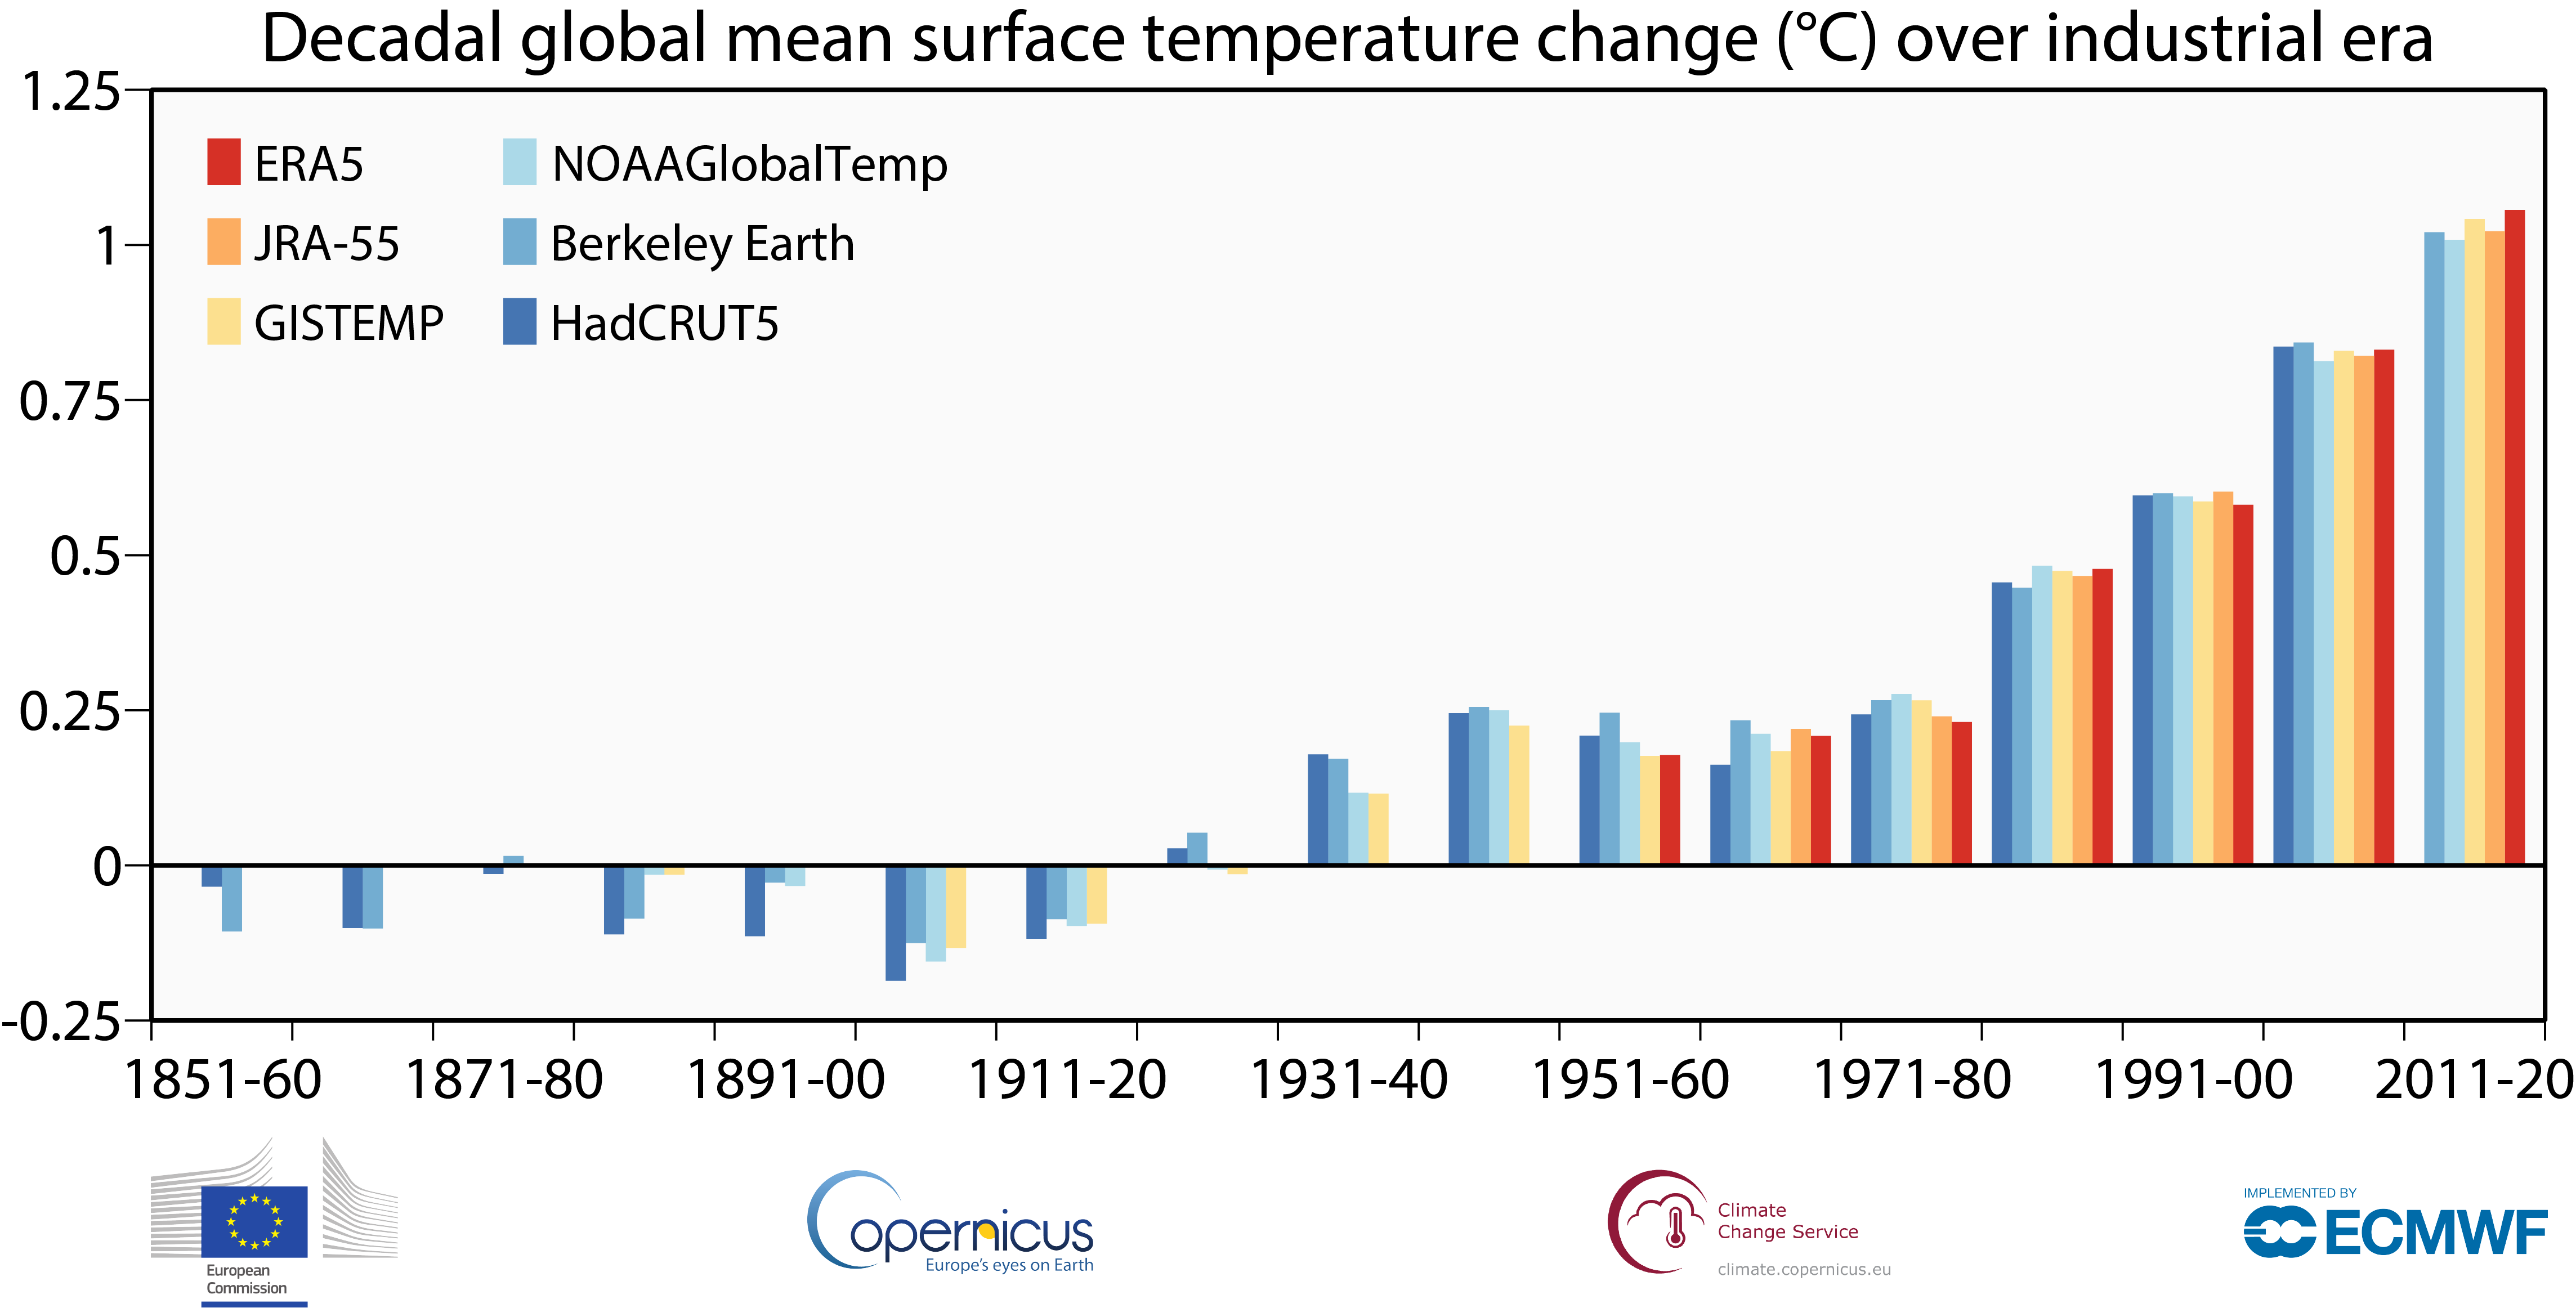
The Copernicus Climate Change Service (C3S) today reveals that globally 2020 was tied with the previous warmest year 2016, making it the sixth in a series of exceptionally warm years starting in 2015, and 2011-2020 the warmest decade recorded. Meanwhile, Europe saw its warmest year on record, 0.4°C warmer than 2019 which was previously the warmest year. Together with the Copernicus Atmosphere Monitoring Service (CAMS), C3S also reports that CO2 concentrations in the atmosphere have continued to rise at a rate of approximately 2.3 ppm/year in 2020 reaching a maximum of 413 ppm during May 2020. Both C3S and CAMS are implemented by the European Centre for Medium-Range Weather Forecasts on behalf of the European Commission with funding by the European Union.
ACCESS TO DATA | DOWNLOAD THE ORIGINAL IMAGE
C3S’s dataset for surface air temperatures shows that:
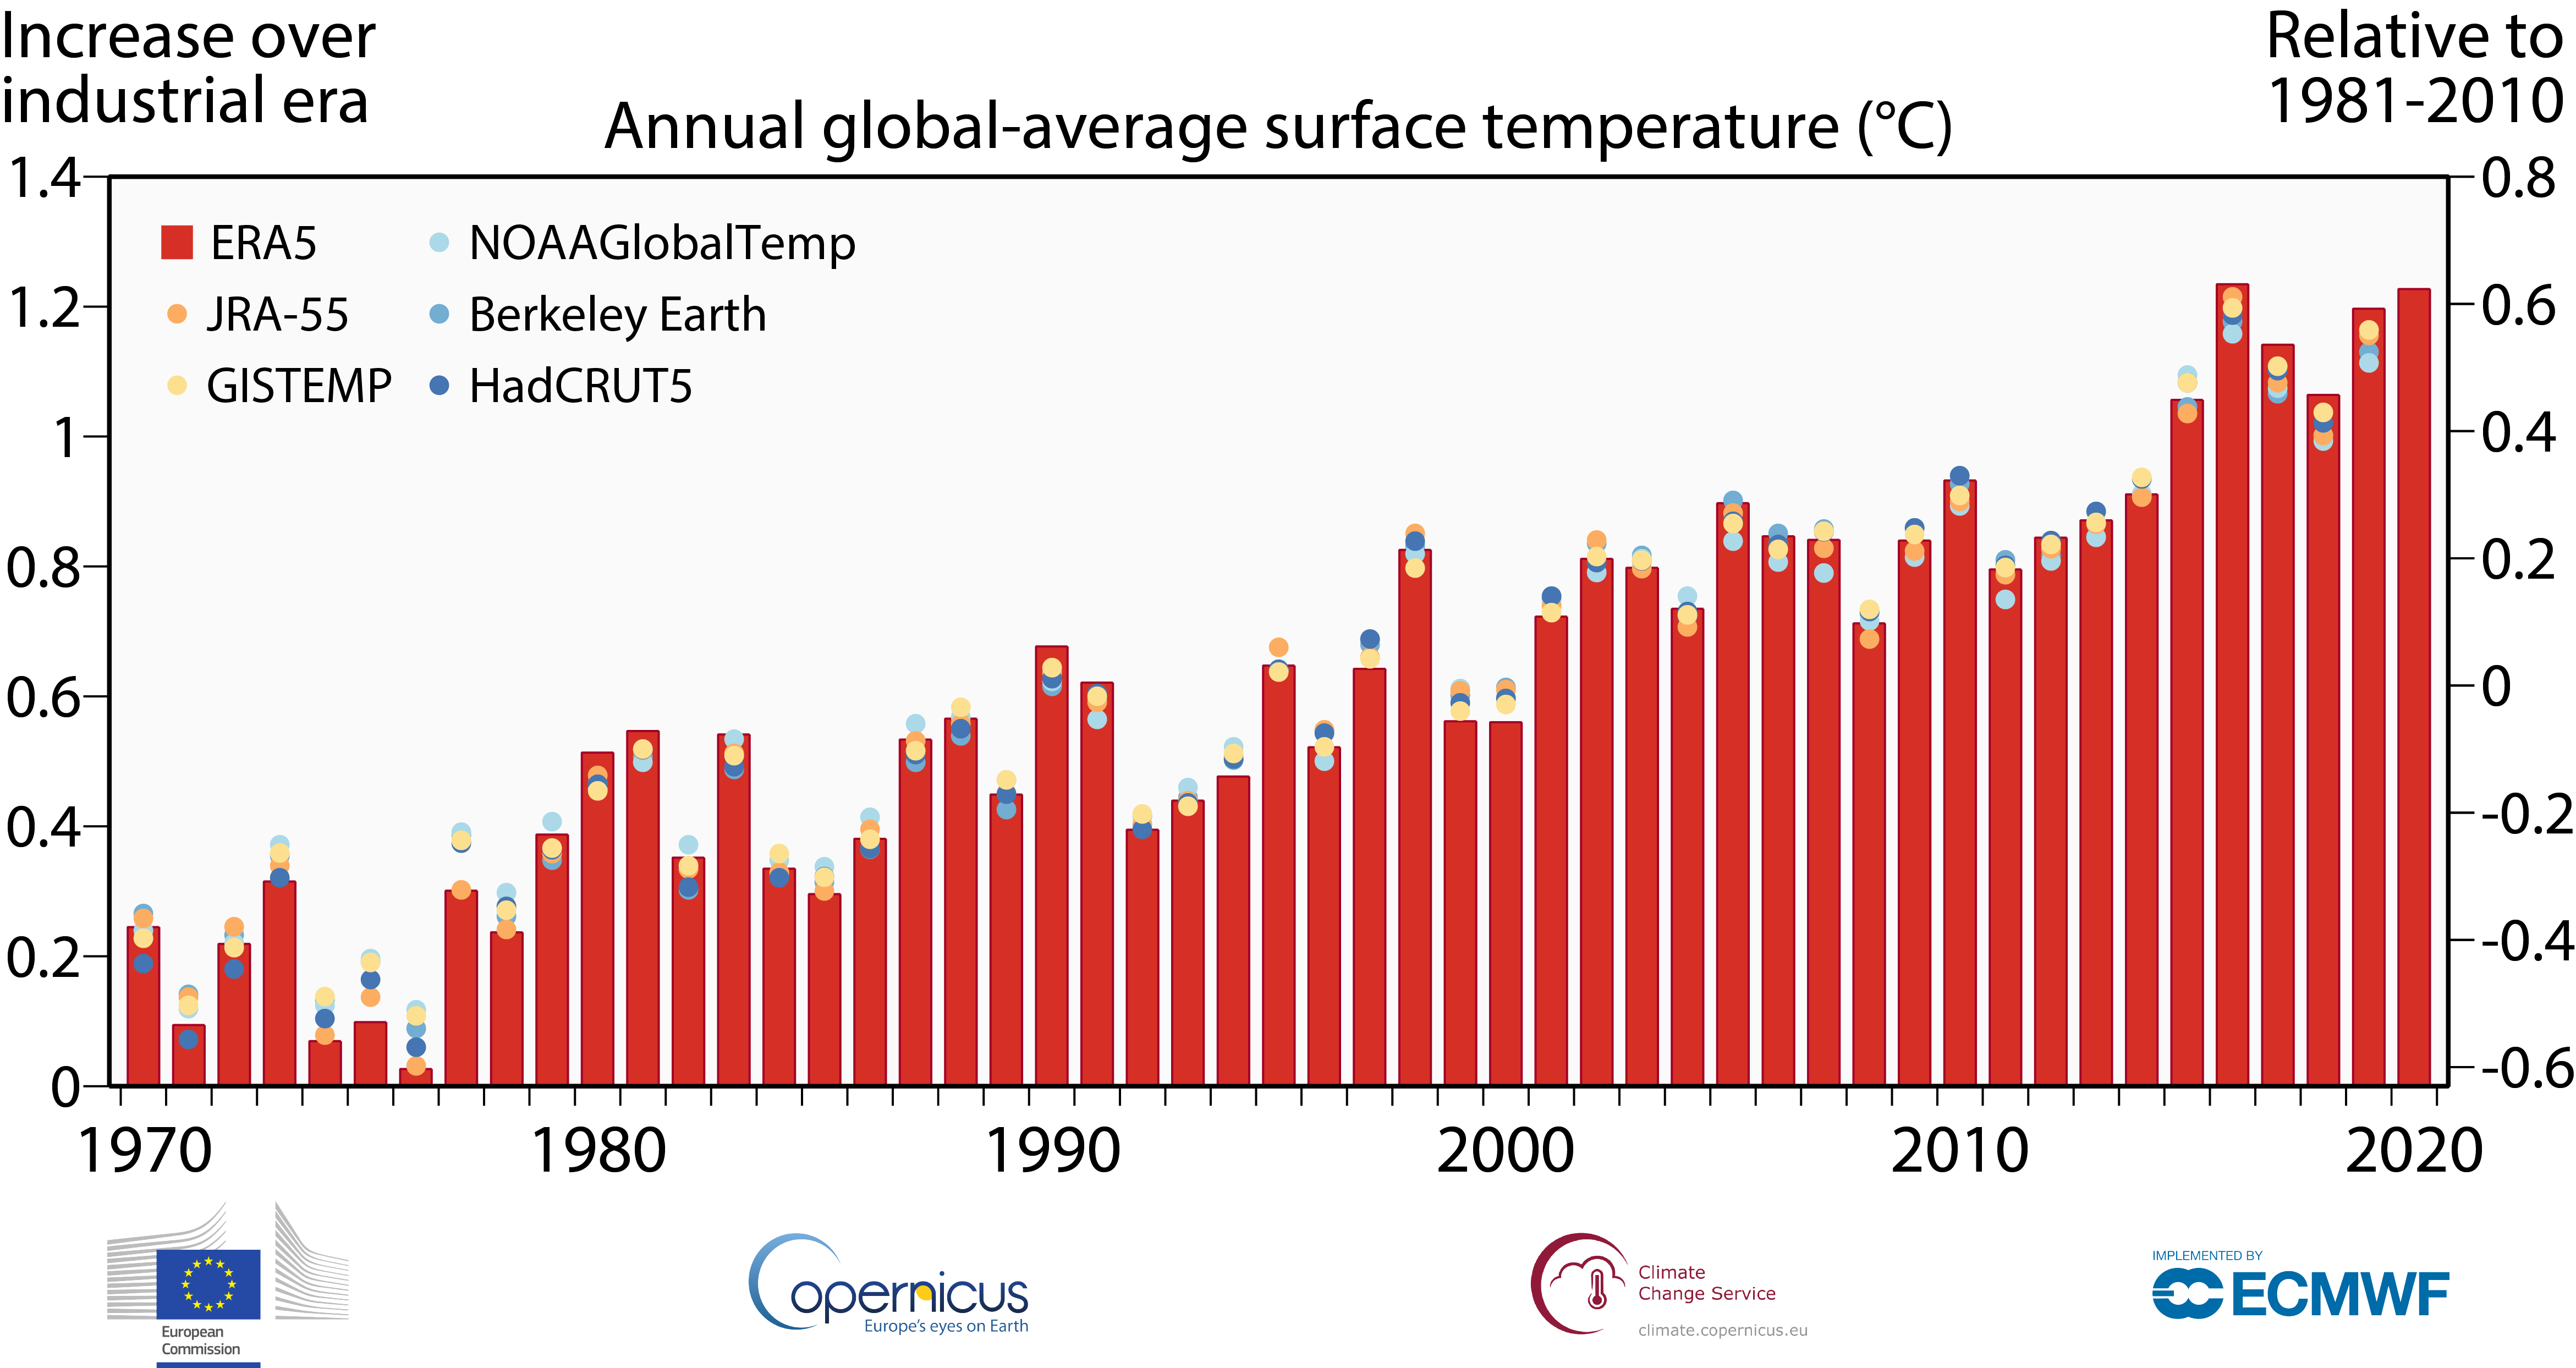
- Globally, 2020 was on a par with the 2016 record
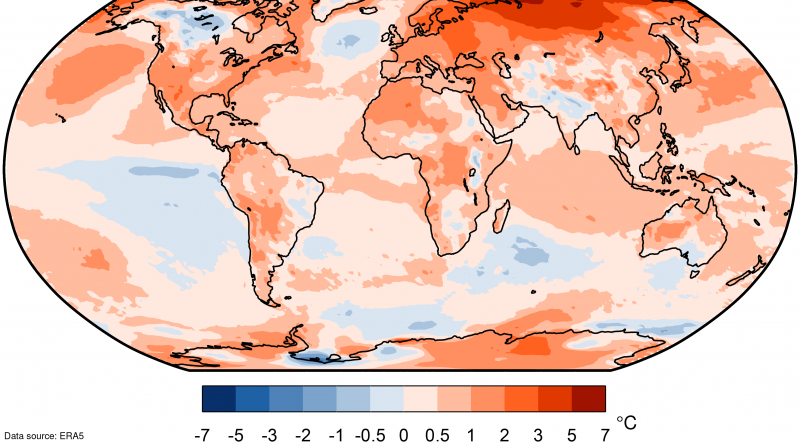
- 2020 was 0.6°C warmer than the standard 1981-2010 reference period and around 1.25°C above the 1850-1900 pre-industrial period
- This makes the last six years the warmest six on record
- Europe saw its warmest year on record at 1.6°C above the 1981-2010 reference period, and 0.4°C above 2019, the previous warmest year
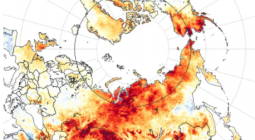
- The largest annual temperature deviation from the 1981-2010 average was concentrated over the Arctic and northern Siberia, reaching to over 6°C above average
Furthermore, satellite measurements of global atmospheric CO2 concentrations show that:
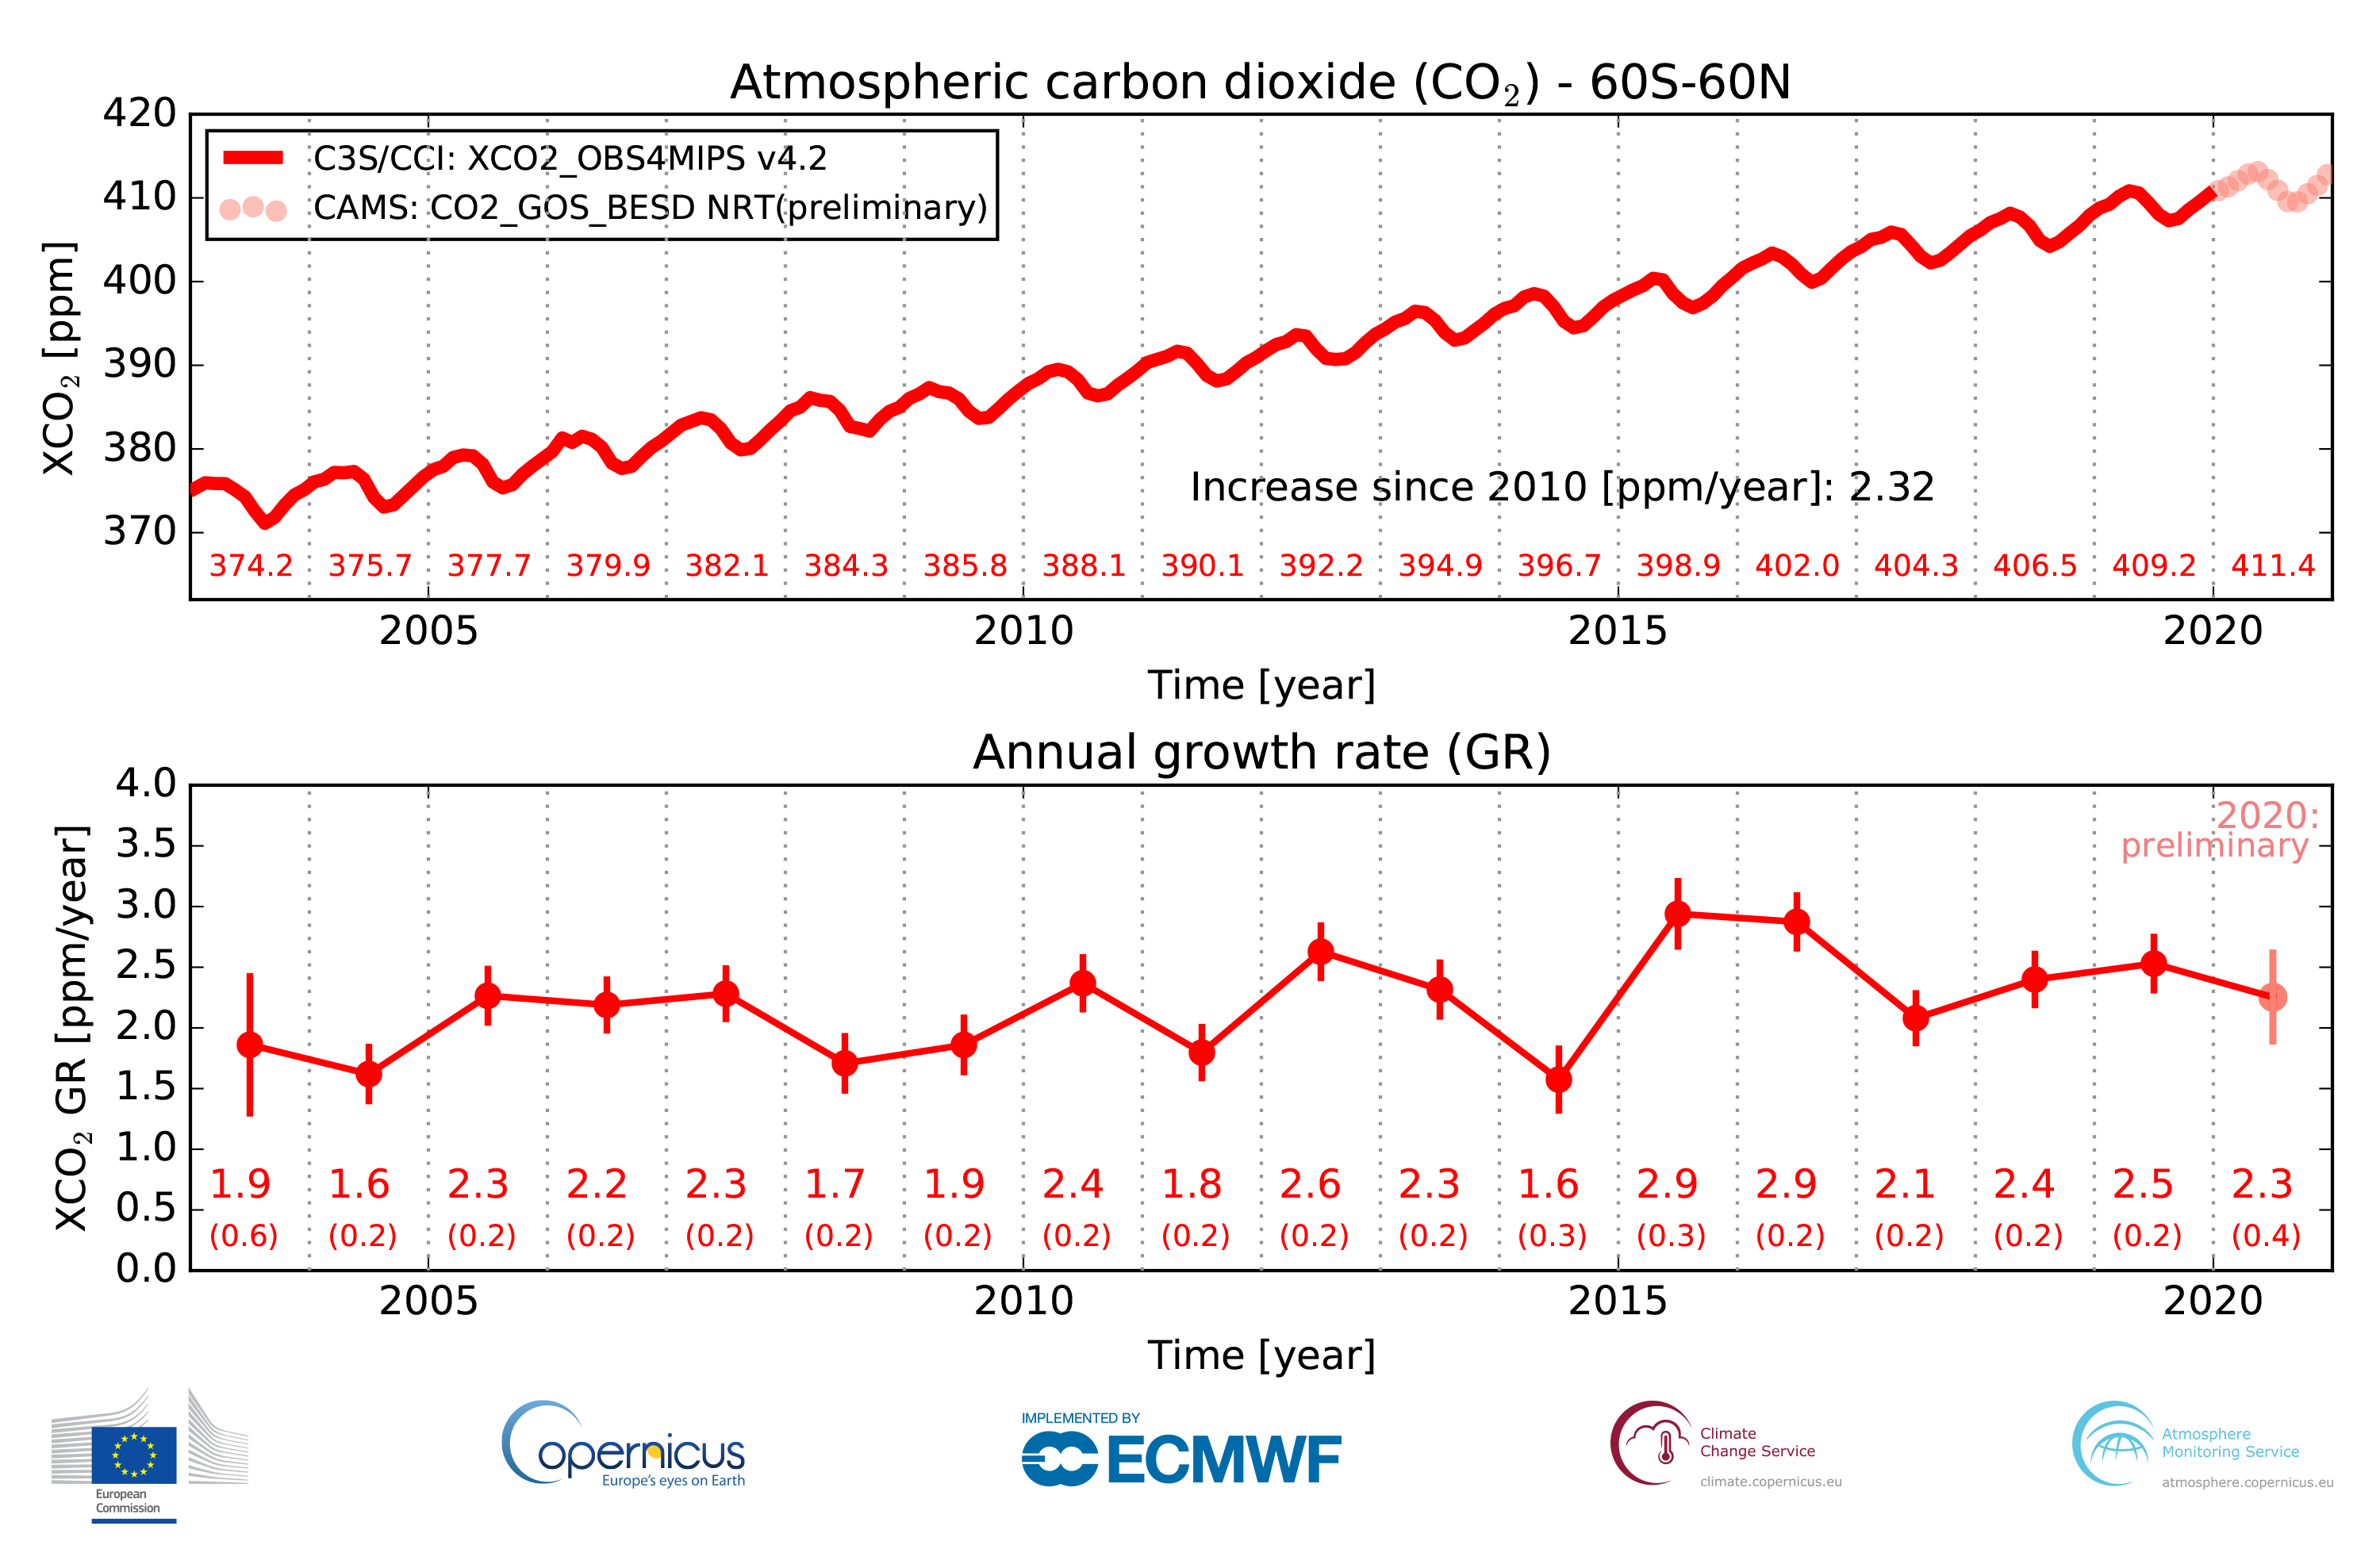
- CO2 global column-averaged maximum reached 413 ppm
- CO2 continued to rise in 2020, increasing by 2.3 ± 0.4 ppm, slightly less than the growth rate of the previous year
Parts of the Arctic and northern Siberia saw some of the largest annual temperature deviations from average in 2020, with a large region seeing deviations of as much as 3°C and in some locations even over 6°C for the year as a whole. On a monthly basis, the largest positive temperature anomalies for the region repeatedly reached more than 8°C. Western Siberia experienced an exceptionally warm winter and spring, a pattern also seen over summer and autumn in the Siberian Arctic and over much of the Arctic Ocean.
Furthermore, the wildfire season was unusually active in this region, with fires first detected in May, continuing throughout summer and well into autumn. As a result, poleward of the Arctic Circle, fires released a record amount of 244 megatonnes of carbon dioxide in 2020, over a third more than the 2019 record. During the second half of the year, Arctic sea ice was significantly lower than average for the time of the year with July and October seeing the lowest sea ice extent on record for the respective month.
In general, the Northern Hemisphere experienced above average temperatures for the year, apart from a region over the central North Atlantic. In contrast, parts of the Southern Hemisphere saw below average temperatures, most notably over the eastern equatorial Pacific, associated with the cooler La Niña conditions developing during the second half of the year. It is notable that 2020 matches the 2016 record despite a cooling La Niña, whereas 2016 was a record year that began with a strong warming El Niño event.
ACCESS TO DATA | DOWNLOAD THE ORIGINAL IMAGE
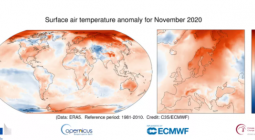
Europe 2020: warmest year on record
2020 was Europe’s warmest year recorded, and seasonally winter 2019/20 and autumn 2020 were also the warmest recorded. Winter 2020, meaning December 2019 to February 2020, exceeded the previous warmest of 2016 by almost 1.4°C, while autumn (September to November 2020) passed the old record set in 2006 by 0.4°C. In addition, western Europe experienced a significant heatwave in late July and early August. The next four warmest years for Europe also happened during the last decade.
A full and detailed analysis of Europe’s climate will be released in April when Copernicus presents its annual European State of the Climate 2020.
Carlo Buontempo, Director of the Copernicus Climate Change Service (C3S), comments: "2020 stands out for its exceptional warmth in the Arctic and a record number of tropical storms in the North Atlantic. It is no surprise that the last decade was the warmest on record, and is yet another reminder of the urgency of ambitious emissions reductions to prevent adverse climate impacts in the future."
CO2 concentrations continue to rise in 2020
ACCESS TO DATA (PART1) | ACCESS TO DATA (PART2) | DOWNLOAD THE ORIGINAL IMAGE
Analysis of satellite data reveals that carbon dioxide concentrations have continued to rise in 2020 reaching an unprecedented global column-averaged maximum of approximately 413.1 ppm. The estimated annual mean XCO2 growth rate for 2020 was 2.3 ± 0.4 ppm/year. This is less than the growth rate in 2019, which was 2.5 ± 0.2 ppm/year and also less than the 2.9 ppm/year increase in 2015 and 2016. However, 2015 and 2016 experienced a strong El Niño climate event, which resulted in a larger atmospheric growth rate due to a weaker than normal uptake of atmospheric CO2 by land vegetation and large CO2 wildfire emissions, particularly in Indonesia in those years. The wildfires in the Arctic and Australia in 2020, although of unprecedented magnitude in their regions, represent only a small fraction of global fire emissions.
Vincent-Henri Peuch, Director of the Copernicus Atmosphere Monitoring Service (CAMS), comments: “While carbon dioxide concentrations have risen slightly less in 2020 than in 2019, this is no cause for complacency. Until the net global emissions reduce to zero, CO2 will continue to accumulate in the atmosphere and drive further climate change.”
In the context of the COVID-19 pandemic, it has been estimated by the Global Carbon Project that there was a reduction of around 7% of fossil CO2 emissions.
“To what extent this was a factor in the lower total increase is debatable though, as the variations in global growth rate are dominated by natural processes. We must continue efforts to decrease CO2 net emissions to reduce the risk of climate-related change”, Vincent-Henri Peuch adds.
“The extraordinary climate events of 2020 and the data from the Copernicus Climate Change Service show us that we have no time to lose. We must come together as a global community, to ensure a just transition to a net zero future. It will be difficult, but the cost of inaction is too great, which is why the commitments made under our European Green Deal are so very necessary”, highlights Matthias Petschke, Director for Space, European Commission’s Directorate-General for Defence industry and Space.
More information on how the data was compiled: https://climate.copernicus.eu/sites/default/files/2021-01/C3S-Annual-end-of-year-2020_notes-to-editors.pdf
Access to data
Processed time series data are available to download below the respective graphic. Spatial data for the temperature anomaly map can be downloaded from the Climate Data Store (CDS - cds.climate.copernicus.eu). Data from Copernicus are subject to the Licence to Use Copernicus Products (v 1.2). Temperature datasets from other providers, which are included here for the purpose of comparison, are subject to other licenses, please check with the respective provider.
The complete C3S datasets (ERA5 (1979-2020), ERA5 preliminary (1950-1978) and “C3S XCO2 data derived from satellite sensors” (2003-2019) are available from the CDS. The complete “CAMS XCO2 data derived from satellite sensors” is available from the data provider Univ. Bremen (http://www.iup.uni-bremen.de/~ghguser/).
The Monthly Climate Bulletin for December can be accessed here: https://climate.copernicus.eu/monthly-climate-bulletins
About ECMWF and Copernicus
Copernicus is the European Union’s flagship Earth observation programme which operates through six thematic services: Atmosphere, Marine, Land, Climate Change, Security and Emergency. It delivers freely accessible operational data and services providing users with reliable and up-to-date information related to our planet and its environment. The programme is coordinated and managed by the European Commission and implemented in partnership with the Member States, the European Space Agency (ESA), the European Organisation for the Exploitation of Meteorological Satellites (EUMETSAT), the European Centre for Medium-Range Weather Forecasts (ECMWF), EU Agencies and Mercator Océan, amongst others.
ECMWF operates two services from the EU’s Copernicus Earth observation programme: the Copernicus Atmosphere Monitoring Service (CAMS) and the Copernicus Climate Change Service (C3S). They also contribute to the Copernicus Emergency Management Service (CEMS). The European Centre for Medium-Range Weather Forecasts (ECMWF) is an independent intergovernmental organisation supported by 34 states. It is both a research institute and a 24/7 operational service, producing and disseminating numerical weather predictions to its Member States. This data is fully available to the national meteorological services in the Member States. The supercomputer facility (and associated data archive) at ECMWF is one of the largest of its type in Europe and Member States can use 25% of its capacity for their own purposes.
ECMWF is expanding its location across its Member States for some activities. In addition to an HQ in the UK and Computing Centre in Italy, new offices with a focus on activities conducted in partnership with the EU, such as Copernicus, will be located in Bonn, Germany from Summer 2021.
climate copernicus