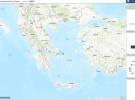
Attribution Map Shows 74% of Extreme Weather and Trends since 2003 Worsened by Human Activity
Three-quarters of all extreme weather events or trends analyzed to date by attribution scientists were made worse by human-caused climate change, Carbon Brief’s latest Attribution Map reveals.
It has been 20 years since the first “extreme event attribution” study, which documented the causes of Europe’s deadly 2003 heat wave that killed an estimated 70,000 people.
In that study, published in Nature in 2004, “the scientists worked out that human influence had at least doubled the risk of such an extreme heatwave occurring,” says Carbon Brief, whose sixth and latest Attribution Map captures all the studies published to date in English.
Interactive and user-friendly, the map offers thumbprint insights into 612 studies that covered 735 extreme events (such as the Australian bushfires of 2019-2020) and a variety of trends, such as data tracking marine heatwaves across decades.
The thumbprints identify a particular extreme event by location, date, and type (heat, rain and flooding, storm, drought, cold, snow and ice, wildfire, and more). They then provide the associated study’s ultimate finding about the role that human-induced climate change played in the event, using four-point, colour-coded scale for events that were:
• More severe or more likely;
• Less severe or less likely;
• Unaffected by any discernable human influence…
…and instances where the available data were insufficient or inconclusive.
Central to each thumbprint is a brief illustrative comment from the study, with links for further information.
“Hot, dry and windy conditions that drove devastating Pantanal wildfires 40% more intense due to climate change,” says the thumbprint summarizing findings by the World Weather Attribution initiative for the 2024 wildfires in one of the world’s largest tropical wetlands in Brazil.
Overall, the map and accompanying analysis reveal that:
• 83% of all events and trends studied were influenced by anthropogenic climate change, and 74% were “more severe or more likely.”
• “More than a third” of the total had to do with heat extremes, a predominance that owes to heat events being “generally the most straightforward events to link to a warming world,” notes Carbon Brief.
• Another 9% of events—mostly involving blizzards or extreme cold—were made less severe or likely by climate change.
• “In the remaining 17% of cases, the studies either found no human influence (10%) or they were inconclusive (7%), often due to insufficient data.”
Heatwaves are relatively easy to attribute to climate change because they’re “mainly driven by thermodynamic influences,” explains Carbon Brief in an associated Q&A. “In contrast, storms and droughts are more strongly affected by complex atmospheric dynamics, so can be trickier to simulate in a model.”
Only a “small fraction” of extreme weather events to date have been subject to an attribution study, most of them in the Global North. A dearth of data on weather extremes in the Global South is one major reason for this data gap.
Recently, China has been taking attribution science seriously: the country accounted for 16% of the cases included in the map, more than 70% of them published within the past four years.
Cover photo: @Osariik/Twitter


